
Engine Stage 2


Thread Starter
Orange Club
Joined: Oct 1998
Posts: 13,763
Likes: 1
Note: If you have problems changing pages on this article, please ensure you have the following option set in your USERCP -> "Number of Posts to Show Per Page" set to "Use Forum Default"
After a very successful Stage 1 for engine modifications to a newage (in this specific case a twin scroll JDM car) we had learnt a number of things about what showed favourable results and perhaps what didnt. The key goal was to maintain and try to improve driveability, but to also keep everything cost effective. Finishing with a car that was more driveable as standard, but by still acheiving over +50bhp and +30lbft more than the base test was very pleasing..... and all for minimal costs. Of course as explained in Engine Stage 1, it's not all about hardcore figures as real road driving is much, much more important and Stage 1 certainly delivered on that.
SUPPORT AND SUPPLY OF PRODUCTS AND SERVICES FOR ENGINE - STAGE 2

Powerstation - Rolling Road Facility, Mapping, Technical Help/Guidance, Product Supplier, Workshop Facilities (fitment/testing of products)

ScoobySport - Product Supplier, Technical Help

Litchfield Imports - Product Supplier, Technical Help

API - Technical Help/Guidance, Product Supplier, Workshop Facilities (fitment/testing of products)
Turbo Dynamics - Technical Help/Guidance, Product Supplier
ECUTEK - Product Supplier
Racelogic - Product Supplier
Is it possible to improve further?
Easy answer should be yes, without a doubt (famous last words)...... but could this be achieved whilst still maintaining and more importantly expanding the driveability, whilst still being cost effective?
Only one way to find out........
Use of additional tools to help us gauge performance increases and help us understand what is going on
For Engine Stage 1 we spent a lot of time using PowerStation's excellent Rolling Road facility as a means to gauge power increases. Whilst we would still be using PowerStation's Rolling Road facilites for Stage 2, it was decided to look at other forms of facilities available to use along side PowerStation's rolling road to see what effect modifications have on the cars performance.
After a very successful Stage 1 for engine modifications to a newage (in this specific case a twin scroll JDM car) we had learnt a number of things about what showed favourable results and perhaps what didnt. The key goal was to maintain and try to improve driveability, but to also keep everything cost effective. Finishing with a car that was more driveable as standard, but by still acheiving over +50bhp and +30lbft more than the base test was very pleasing..... and all for minimal costs. Of course as explained in Engine Stage 1, it's not all about hardcore figures as real road driving is much, much more important and Stage 1 certainly delivered on that.
SUPPORT AND SUPPLY OF PRODUCTS AND SERVICES FOR ENGINE - STAGE 2
Powerstation - Rolling Road Facility, Mapping, Technical Help/Guidance, Product Supplier, Workshop Facilities (fitment/testing of products)
ScoobySport - Product Supplier, Technical Help
Litchfield Imports - Product Supplier, Technical Help
API - Technical Help/Guidance, Product Supplier, Workshop Facilities (fitment/testing of products)
Turbo Dynamics - Technical Help/Guidance, Product Supplier
ECUTEK - Product Supplier
Racelogic - Product Supplier
Is it possible to improve further?
Easy answer should be yes, without a doubt (famous last words)...... but could this be achieved whilst still maintaining and more importantly expanding the driveability, whilst still being cost effective?
Only one way to find out........
Use of additional tools to help us gauge performance increases and help us understand what is going on
For Engine Stage 1 we spent a lot of time using PowerStation's excellent Rolling Road facility as a means to gauge power increases. Whilst we would still be using PowerStation's Rolling Road facilites for Stage 2, it was decided to look at other forms of facilities available to use along side PowerStation's rolling road to see what effect modifications have on the cars performance.
Last edited by ex-webby; Feb 19, 2008 at 05:16 PM.
Thread Starter
Orange Club
Joined: Oct 1998
Posts: 13,763
Likes: 1
Delta Dash by ECUTEK
Ever wanted to know what else the likes of PowerStation use to monitor readings from the engine whilst mapping (and far more besides)? Then read on.....
Delta Dash is an invaluable tool when mapping a car via ECUTEK, as it allows the operator to monitor and log all the readings that the ECU see's. Delta Dash is a piece of software (like ECUTEK) that allows the user to interogate the ECU and log details whilst the engine is running. Not only this, but the sophisticated software enables the user to overlay results making comparison between comparable data sets very easy. When your car is being mapped with ECUTEK the mapper would also use Delta Dash to see what effects these map changes have on the engine (via the various sensors already there) both in realtime and for comparison afterwards. This facility alone is very useful as it enables the mapper to log results for immediate LIVE viewing or comparison at a later time. As this data is read directly from the ECU, it enables the mapper to see in real terms what is happening with the engine from the various sensors that are already installed, which is all vital when determining the best parameters. Of course not only as an aid to mapping, Delta Dash can also help to diagnose faults within the engine or at least give a better indication of the specific area to look at.
Whilst the above is a very simplistic overview of what Delta Dash provides to the professional, Delta Dash also has many facilities that are useful to the enthusiast.
So what is all this functionality and what does it all mean?
Last edited by ex-webby; Feb 27, 2007 at 05:14 PM.
Thread Starter
Orange Club
Joined: Oct 1998
Posts: 13,763
Likes: 1
Live ECU Data Capture
As already explained the data capture side of Delta Dash is without doubt it's primary use, but what does this actually do?
In basic terms, the ECU reads a varied number of sensors (some dependant on OEM ECU version). Upon looking at the sensor readings available, you may be overwhelmed by what data sets can be logged. Whilst some may be meaningful, others will have the reaction of "What the hell does that mean?". Obviously to a professional or very very knowledgable enthusiast, this will equate to useful data but in reality the majority of us will neither understand or be interested to a degree...... but make no mistake, they are all real data sets that are all meaningful and required.
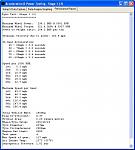
There are 3 main data logging screens in Delta Dash, with the first one being the "Analogue Data" tab.
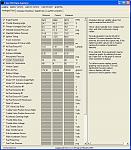 As you can see from the picture to the right, all the available (again dependant on ECU etc) logging facilities are listed, with three other columns showing the Minimum, Current (LIVE) and Maximum values attained. Quite simply, all you need to do is tick the required logs you wish to record and Delta Dash will start logging them.
The second main data logging screen in Delta Dash is the "Analogue Graphing" tab.
 The data shown to the right is same data sets that you have chosen via the "Analogue Data" tab, but instead of displaying this numerically, this screen shows them in a graphical format (which can make it easier to read). As more facilities are described, you will understand that this graphical display becomes very powerful.
The third main data logging screen in Delta Dash is the "Digital Data" tab.
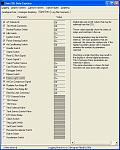 The picture to the right shares simularities with the "Analogue Data" tab, in which it enables you to tick appropriate sensor's to log. The main difference with this screen is that it analyses the digital (on and off) status of chosen parts (very good for some fault diagnosis of certain parts).
Once a log file has been created, this is when it gets really interesting and the true power of the data logging facilities are unleashed.
As already explained the data capture side of Delta Dash is without doubt it's primary use, but what does this actually do?
In basic terms, the ECU reads a varied number of sensors (some dependant on OEM ECU version). Upon looking at the sensor readings available, you may be overwhelmed by what data sets can be logged. Whilst some may be meaningful, others will have the reaction of "What the hell does that mean?". Obviously to a professional or very very knowledgable enthusiast, this will equate to useful data but in reality the majority of us will neither understand or be interested to a degree...... but make no mistake, they are all real data sets that are all meaningful and required.
There are 3 main data logging screens in Delta Dash, with the first one being the "Analogue Data" tab.
The second main data logging screen in Delta Dash is the "Analogue Graphing" tab.
The third main data logging screen in Delta Dash is the "Digital Data" tab.
Once a log file has been created, this is when it gets really interesting and the true power of the data logging facilities are unleashed.
Last edited by ex-webby; Jan 30, 2007 at 06:31 PM.
Thread Starter
Orange Club
Joined: Oct 1998
Posts: 13,763
Likes: 1
There are four main displays for showing the stored data logs.
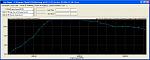
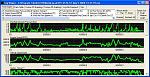 The picture to the right shows the data that has been logged with Delta Dash whilst on a run (the "Time Graph") and is very similar to the "Analogue Graphing" function showed previously. With this screen though many other functions are available for comparison and diagnostics. One of the key functions of this is to enable you to zoom in on a specific of a run and compare log captures at each time interval moving along that part of the run and looking to see what other variables were captured at the same time period. Sounds complicated..... buts it is very easy to use and understand.
As an example, lets look at the following values MAP (boost), Engine Speed (RPM), Intake Air Temperature and Max. Wastgate Duty (how hard the boost solenoid is working to achieve boost).
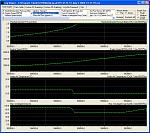 The picture to the right shows the required values wanted and zoomed in to a specific part of the run with all values in-line with each other as regards to time (therefore you can look at specifically what boost, rpm, intake temp. and wastegate duty cycle was recorded at any single point in time). The right hand side of the screen shows exactly what these values are and you can highlight and move backwards and forwards across each log value. Based on this example, you can now easily and accurately look at your boost profile through the revs and determine precisely where you reach (for example) 1bar of boost and full boost and at which RPM you boost starts to reduce etc.
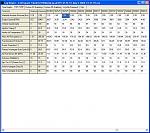 The picture opposite is the second type of display which is called the "Data Table". This shows all the values numerically (which are translated graphically in the "Time Graph" window) that have been captured against each time interval.
 The picture to the right is the third (and perhaps second most useful layout after the "Time Graph" view) view which is "Custom 2D Graphing". In this view you are able to compare two overlaid sets of data on the same graph. This is very good for comparing like for like data sets, which in the example shown above is Coarse Ignition Correction against Knock Correction. The above example shows that Coarse Correction map is more or less in sync with the live knock correction which is good.... you could of course have different results showing that knock correction was pulling or adding more ignition, which would lead you to thinking that the ignition maps could be optimised further.
 The picture opposite is the fourth view which is "Custom 3D Graphing". Similar to the 2D mapping this lets you compare data sets, but this time three in a 3D graphical format.
This is a very brief summary of the main functions of Delta Dash as a diagnostics tool for mapping and fault finding. Whilst this may not be of interest to all, it certainly gives the enthusiast an insight to what the engine is doing under various conditions and is a sound platform to use to learn about what makes your engine tick.... especially those wishing to get to grips with the in's and out's.
As an example, lets look at the following values MAP (boost), Engine Speed (RPM), Intake Air Temperature and Max. Wastgate Duty (how hard the boost solenoid is working to achieve boost).
This is a very brief summary of the main functions of Delta Dash as a diagnostics tool for mapping and fault finding. Whilst this may not be of interest to all, it certainly gives the enthusiast an insight to what the engine is doing under various conditions and is a sound platform to use to learn about what makes your engine tick.... especially those wishing to get to grips with the in's and out's.
Last edited by ex-webby; Jan 30, 2007 at 07:40 PM.
Thread Starter
Orange Club
Joined: Oct 1998
Posts: 13,763
Likes: 1
Road Dyno
Another key function of Delta Dash is the "Road Dyno" function. Ever fancied doing your own dyno plot runs and looking at other performance information about your car like in-gear acceleration times..... well you can with this piece of software.
After you have setup specific parameters about your vehicle (key things being gearbox type and ratios, wheel and tyre size, rev limit, vehicle weight and test gear) you can then progress to running and recording data based on a power run.
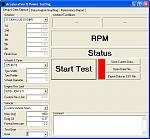 The power run is recorded by simply ensuring you are in the correct key that has been stated in setup, clicking the START button on the screen, being at about 3k rpm and then letting the revs drop below approximately 1800rpm. The screen then tells you to accelerate in the gear selected. When you have reached the desired peak revs, you then let the vehicle revs drop and the power run log will stop.
Sounds good so far?
Now you get to see the results!
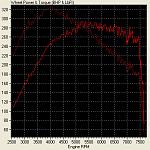
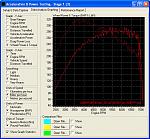 You have many different data sets to plot on the graph shown opposite, but for this explanation we will concentrate on the widely used BHP and TORQUE graph most commonly associated with normal rolling roads. As you can see from the example, Road Dyno can create a BHP / TORQUE Vs RPM.
How accurate is it though?
Another key function of Delta Dash is the "Road Dyno" function. Ever fancied doing your own dyno plot runs and looking at other performance information about your car like in-gear acceleration times..... well you can with this piece of software.
After you have setup specific parameters about your vehicle (key things being gearbox type and ratios, wheel and tyre size, rev limit, vehicle weight and test gear) you can then progress to running and recording data based on a power run.
Sounds good so far?
Now you get to see the results!
How accurate is it though?
Last edited by ex-webby; Feb 27, 2007 at 05:16 PM.
Thread Starter
Orange Club
Joined: Oct 1998
Posts: 13,763
Likes: 1
Well first off you have to appreciate that the figures are at the wheels (whereas most Rolling Roads will give these figures at the FlyWheel), but with tests that we have completed and as long as the setup entries have been done correctly (the weight is really important and must be accurate), the runs (for back to back comparison with subsequent Road Dyno runs) are completed on the same patch of road and conditions, the results are both constant and very comparable to a rolling road.
The beauty of this piece of software is that you can also overlay runs (up to four) on the same graph, so this in itself will give you clear indications in the power curves of runs, if modifications you make have a improvement (or not). Whilst I would not suggest you use this as the only means to gain power / performance figures (a rolling road is still the safest and most reliable method), it is a facility you can use yourself for your own information.
On top of the graph, you can also use the "Performance Report" feature, which tells you your In Gear Acceleration times.
 As shown, this coupled with the power graph gives you even more information to base results on from modifications that have been done.
With the use of a laptop and supplied cable / software, I think you may agree that Delta Dash is a very powerful piece of software. Other functions of the software include the ability to:
Read Fault Codes
Reset the ECU
Adjust ignition retard
Adjust idle speeds
Live tuning option (with the appropriate ECUTEK mapping options set)
As part of this modification article, we will certainly be using various performance measuring functions of Delta Dash along with the conventional Rolling Road and other facilities to gain even more information about what we test.
The beauty of this piece of software is that you can also overlay runs (up to four) on the same graph, so this in itself will give you clear indications in the power curves of runs, if modifications you make have a improvement (or not). Whilst I would not suggest you use this as the only means to gain power / performance figures (a rolling road is still the safest and most reliable method), it is a facility you can use yourself for your own information.
On top of the graph, you can also use the "Performance Report" feature, which tells you your In Gear Acceleration times.
With the use of a laptop and supplied cable / software, I think you may agree that Delta Dash is a very powerful piece of software. Other functions of the software include the ability to:
Read Fault Codes
Reset the ECU
Adjust ignition retard
Adjust idle speeds
Live tuning option (with the appropriate ECUTEK mapping options set)
As part of this modification article, we will certainly be using various performance measuring functions of Delta Dash along with the conventional Rolling Road and other facilities to gain even more information about what we test.
Last edited by ex-webby; Feb 27, 2007 at 05:16 PM.
Thread Starter
Orange Club
Joined: Oct 1998
Posts: 13,763
Likes: 1
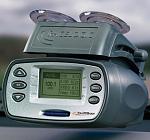
Drift Box by RaceLogic
Performance monitoring as regards to recording 0-60, 0-100 & 1/4m times has always been a bit hit and miss as far as the high street consumer has been concerned. Whilst a number of solutions have existed that are very accurate, the costs involved with these solutions has always been out of reach, except for those that require such equipment for official testing and have the budgets to substantiate such equipment.
With the advancements of GPS and the keen pricing of such equipment to the general consumer sector a new solution has appeared on the market that now makes this kind of performance testing, both extremely cost effective and accurate.
RaceLogic have constructed an all-in-one solution that combines a single unit that not only houses all the sensors, GPS receivers and built in screen, but it also gives the ability to log results which can be stored on a memory card and later read and analysed using some very powerful software supplied. All you need is a *** lighter socket (for power) and off you go�� sounds too simple to actually be true and accurate doesn�t it�.. well let me assure you it is certainly both simple to use and very accurate.
Firstly don�t let the name Drift Box put you off�.. this little box of tricks is far more than a box that shows you drift angles!
The package itself is split in to four uses:
Performance Meter
0-60
0-100
0-100-0
Various in-gear times
1/8m
1/4m
1/2m
1m
And more
Drift Analyser
Drift angle
Peak g
And more
Lap Timer
Full laptiming
Split timing
Last lap time
Best lap time
Data Logger
Full logging and analysis facilities
Trending Topics
Thread Starter
Orange Club
Joined: Oct 1998
Posts: 13,763
Likes: 1
For the purpose of this article and testing we will be concentrating on the uses of the Performance Meter, Lap Timer and Data Logger.
Performance Meter
 With the DriftBox it is very easy to measure acceleration times, braking distances, quarter miles times and much more. There are a number of configurable screens that show specific test results such as 0-60, 0-100, 0-100-0, 1/2 miles and 1/4 mile etc.
DriftBox is based on the Racelogic VBOX, which is used by the majority of Car Manufacturers, Tyre Manufacturers and car magazines around the world to assess performance.
Because it is very easy to edit the test ranges, DriftBox is a very powerful tool for use in many different kinds of vehicle testing.
Lap Timing
Displaying your lap times as you drive around a circuit is simple with DriftBox. You can display your current, last and best lap times, and also display plit times for up to six specified split points around the lap.
Through the DriftBox forum you are able to download circuit overlays from around the world, compare lap times, and share lap overlay data with other users.
Data Logging
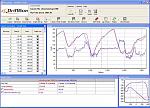 Every item of data that the DriftBox displays (and loads more besides) is logged and can be recorded on a SD card. This can be read in to a PC at a later date to analyse. The piece of software that comes with the DriftBox to enable this function is very powerful indeed, giving you many different tabular and graphing facilities to display and compare the information captured. The software will even enable you to "play back" captured data sets on screen.
How accurate is it?
Amazingly accurate!!!!!
The lap timing mode proved to be within .1 seconds accurate of official track timing equipment.
The performance meter proved to be within .1 seconds accurate of several FIA approved drag strips for the 1/4m.
All of these items of performance measurement and tuning will be used throughout this article and future ones (where applicable), showing pictures of the facilities in action and the results achieved.
Performance Meter
DriftBox is based on the Racelogic VBOX, which is used by the majority of Car Manufacturers, Tyre Manufacturers and car magazines around the world to assess performance.
Because it is very easy to edit the test ranges, DriftBox is a very powerful tool for use in many different kinds of vehicle testing.
Lap Timing
Displaying your lap times as you drive around a circuit is simple with DriftBox. You can display your current, last and best lap times, and also display plit times for up to six specified split points around the lap.
Through the DriftBox forum you are able to download circuit overlays from around the world, compare lap times, and share lap overlay data with other users.
Data Logging
How accurate is it?
Amazingly accurate!!!!!
The lap timing mode proved to be within .1 seconds accurate of official track timing equipment.
The performance meter proved to be within .1 seconds accurate of several FIA approved drag strips for the 1/4m.
All of these items of performance measurement and tuning will be used throughout this article and future ones (where applicable), showing pictures of the facilities in action and the results achieved.
Thread Starter
Orange Club
Joined: Oct 1998
Posts: 13,763
Likes: 1
Now that we have explained what other facilities we will be using on top of proven methods used in Stage 1..... lets get to the main discussion, ENGINE MODIFICATIONS - STAGE 2!
STAGE 2 - ENGINE MODIFICATIONS
So here we are! After a very successful Stage 1 of modifications, producing 368.4bhp and 337.02 lb ft (at the flywheel) we were very happy with what had been achieved with a basic set of modifications. We were however aware that further "fine tuning" could of taken place to further enhance figures and driveability (especially the torque), but decided that these areas could be picked up within Stage 2.
Stage 1 proved that whilst good gains could be achieved from the basic elements of getting more air in and then out (together with the appropriate mapping technics) utilising better induction and exhaust design, we knew that the standard turbo was getting close to it's limit regarding air flow. Along side this, Stage 1 proved how efficient the standard airbox and Top Mounted InterCooler (TMIC) was, contrary to belief and comparison with lesser efficient earlier versions of these (i.e. TMIC on pre-newage cars).
Again, keeping cost vs performance paramount coupled with the remit of keeping present levels of driveability (if not better) we set about delving further in to what could be looked at next.
Last edited by ex-webby; Feb 27, 2007 at 05:17 PM.
Thread Starter
Orange Club
Joined: Oct 1998
Posts: 13,763
Likes: 1
TurboCharger
PowerStation & Litchfield Imports have perhaps more understanding than most regarding the twin scroll setup of the Newage JDM Subaru. Having completed a lot of development work with Turbo Dynamics on their original Type25 platform, who better to turn to for discussions around a new hybrid version of the standard twin scroll. PowerStation were instrumental in Engine Stage 1, and since discussions of what Stage 2 could include started mid way through Stage 1, it would come as no surprise that both companies would be heavily involved again.
The Basics
I�m sure we are all aware of what a turbo charger is and does, right?
For the uninitiated here is a simplistic explanation.
A turbo charger consists of two elements, the cold side (which is the inlet side, taking in air from the atmosphere) and the hot side (which expels hot exhaust gases through the exhaust system). Between the cold and hot chambers is a shaft that has respective rotary blades in each sides.
The concept of a turbo charger is to force air in to the combustion chamber in a denser way. The logic is more air (more dense) means more fuel can be burnt with a total process of achieving more power.
The hot side of the charger actually drives the inlet �suction� process by the exhaust gases turning the hot side blades, which in turn is driving the shaft which turns the cold side blades (impellar) causing suction.
Even though there is more to specifications of turbo chargers than this, in general terms the blade size and subsequent housing size (which the blades are encased by) stipulate how much air a turbo can flow (which results in given bhp results).
Also in general terms, the larger the rotary blades (wheel) and housing, the greater any lag will be and in turn the power band will be shifted.
This is only touching the tip of the iceberg concerning turbo charger design and concepts discussion.
Thread Starter
Orange Club
Joined: Oct 1998
Posts: 13,763
Likes: 1
Test 1 � Base Figure
As with Stage 1, we needed to start with a base figure relating to the stage of tune prior to any work on Stage 2 for ongoing comparisons. Even though all mapping and initial trialling of changes will still be made using PowerStation�s facilities, it was decided to use power run comparison�s using Delta Dash � Road Dyno for this specific article.
TEST 1 � Base Figure - Summary of Spec
 Standard JDM Spec C MY03 Engine & Turbo
K&N Panel Filter
Standard Inlet Pipe
ScoobySport Twin Scroll De-Catted Exhaust System - 3" from turbo to backbox, no resonator, straight back box design
ECUTEK remapped ECU modified from basic UK Fuel map
Uprated Actuator
3 Port Boost Solenoid
Peak Boost - 1.6bar
Fuel - Optimax
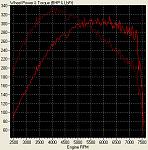
(Graph shows TEST1)
TEST 1 figure achieved was 295bhp with 324lb ft torque @ THE WHEELS
As with Stage 1, we needed to start with a base figure relating to the stage of tune prior to any work on Stage 2 for ongoing comparisons. Even though all mapping and initial trialling of changes will still be made using PowerStation�s facilities, it was decided to use power run comparison�s using Delta Dash � Road Dyno for this specific article.
TEST 1 � Base Figure - Summary of Spec
K&N Panel Filter
Standard Inlet Pipe
ScoobySport Twin Scroll De-Catted Exhaust System - 3" from turbo to backbox, no resonator, straight back box design
ECUTEK remapped ECU modified from basic UK Fuel map
Uprated Actuator
3 Port Boost Solenoid
Peak Boost - 1.6bar
Fuel - Optimax
(Graph shows TEST1)
TEST 1 figure achieved was 295bhp with 324lb ft torque @ THE WHEELS
Thread Starter
Orange Club
Joined: Oct 1998
Posts: 13,763
Likes: 1
TEST 2 � As Per TEST1 plus Hybrid Turbo Dynamics Twin Scroll Turbo and remapping � Overview
After careful consideration it was decided that initially we would look at improving the turbo charger design to try and improve on mid range punch, whilst still maintaining the quicker spool up of the standard twin scroll design, so evident during Stage 1.
Using basic concepts of how a turbo charger functions, it was decided that increasing the wheel housings and wheel sizes, whilst improving power, would be detrimental to driveability low down. It would be paramount that this area could not be compromised, although realising this would cap any major power gains, it was decided that this remit was more important for this specific level of tune.
PowerStation / Litchfield were aware of various combinations already tested during their development of the Type25, so this was the starting point for initial thoughts.
Looking at the market place it was evident that hardly any development had been completed by other companies in the twin scroll arena. Various options already available (based on reports and information available) gave mediocre performance gains, but increased lag by a fair amount. This at least gave us areas of modification to avoid.
Sticking with the standard size housing (to aid response) meant we were limited to what we could have modified on the standard unit, but discussions then started between PowerStation / Litchfield and Turbo Dynamics (one of the largest and most respected Turbo suppliers in the country) based on what we wanted the unit to achieve.
As well as the increase in mid-range power, we also wanted the unit to have a wider power range since the standard unit started to loose power around 6k rpm. We also wanted to eliminate any hints of low down surge, which was something the standard twin scroll unit gave (depending on boost and induction type used).
After a number of discussions between PowerStation / Litchfield and Turbo Dynamics, a new version of the twin scroll turbo was delivered for testing.
Thread Starter
Orange Club
Joined: Oct 1998
Posts: 13,763
Likes: 1
Turbo Dynamics Hybrid Twin Scroll Turbo
What is a Hybrid?
Well, taking a standard turbo and modifying it with either brand new designed parts or parts from existing turbo�s available gives the term of �Hybrid�. It�s as simple as that (well, not quite simple as regards to what has to be done, but simple as regards to explaining what the term means).
Upon receiving the turbo charger it didn�t look any different initially (to the un-trained eye) than the standard one sent to Turbo Dynamics as the donor. Whilst a number of changes can be made that are hidden to the eye (as they can be internal), the use of the generic term �Hybrid� being used you would half expect some kind of item having other parts stuck on to it. Obviously this could not be further from the truth as modifications made to units takes a lot of thought and experience to gain the required results.
Looking closer (or more importantly, knowing what to look at) it is clearly evident that a number of changes / modifications have been undertaken by Turbo Dynamics.
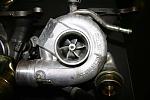 The picture to the right shows the Inlet of the original Twin Scroll IHI VF36. As you can see it clearly shows 6 blades on the wheel.
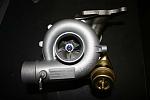 The Picture to the right shows the Inlet of the Turbo Dynamics Hybrid IHI VF37. As you can see it clearly shows 5 blades on the wheel, which are actually double edged. This changed Inlet Wheel design is to increase response, thus decreasing lag.
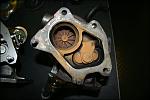 The picture to the right shows the standard VF36 exhaust side. The top left hand corner is the exhaust wheel and the bottom right is the internal wastegate. Notice the "rusty" colour. This is due to the use of Octane Boosters, but nothing to worry about.
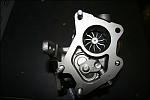 The picture opposite shows the exhaust side of the Turbo Dynamics Hybrid Twin Scroll turbo. At first you notice that both turbos look different on the exhaust side. This is primarily due to the fact that the hybrid was based on a standard VF37, which is from the standard STi Twin Scroll car and differs slightly to the VF36 which is a Spec C specific turbo. Since the turbo was being made in to a hybrid, the donor turbo type (either a VF36 or VF37) was not an issue. The main point worth noting, although quite difficult to see on the image, is the exhaust wheel on the hybrid turbo has cut-back blades.
What did all these changes mean? Well we wanted to improve mid range response without sacrificing low down torque. So Turbo Dynamics used the latest 5 blade high response compressor wheel with a modified cover (instead of the standard 6 blade design) to improve the lowdown spool. They then modified the turbo shaft with cut-back blades to allow the turbo to breathe more easily at higher RPM. Would it work..... lets find out.
What is a Hybrid?
Well, taking a standard turbo and modifying it with either brand new designed parts or parts from existing turbo�s available gives the term of �Hybrid�. It�s as simple as that (well, not quite simple as regards to what has to be done, but simple as regards to explaining what the term means).
Upon receiving the turbo charger it didn�t look any different initially (to the un-trained eye) than the standard one sent to Turbo Dynamics as the donor. Whilst a number of changes can be made that are hidden to the eye (as they can be internal), the use of the generic term �Hybrid� being used you would half expect some kind of item having other parts stuck on to it. Obviously this could not be further from the truth as modifications made to units takes a lot of thought and experience to gain the required results.
Looking closer (or more importantly, knowing what to look at) it is clearly evident that a number of changes / modifications have been undertaken by Turbo Dynamics.
What did all these changes mean? Well we wanted to improve mid range response without sacrificing low down torque. So Turbo Dynamics used the latest 5 blade high response compressor wheel with a modified cover (instead of the standard 6 blade design) to improve the lowdown spool. They then modified the turbo shaft with cut-back blades to allow the turbo to breathe more easily at higher RPM. Would it work..... lets find out.
Last edited by ex-webby; Feb 6, 2007 at 06:54 PM.
Thread Starter
Orange Club
Joined: Oct 1998
Posts: 13,763
Likes: 1
Fitment of Turbo Dynamics Hybrid Twin Scroll Turbo
 Ok... we have been here before as regards to stripping the TMIC etc as this was done in Engine Stage 1, so we wont spend too much time on explaining this in minute steps.
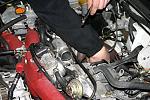
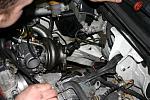
 The picture opposite shows the strut brace removed and the intercooler disconnected, ready for total removal. In essence a turbo removal should be quite stress free on a Subaru. The only point that is not shown with pictures here, is the need for an oil change prior to a new turbo going on.
 With everything out of the way the next step is to remove the downpipe away from the back of the turbo. As you may appreciate because of the hot temperatures involved in exhaust gases, you can have problems getting the nuts off the studs holding the downpipe on.... you may even shear a nut/thread so be warned.
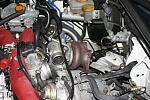 With the downpipe off, all the rest of the connections to the turbo need to be disconnected. These would include the inlet pipe (from the airbox), water pipes (both inlet and outlet) and of course the oil feed (inlet and outlet).
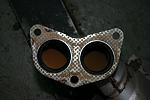
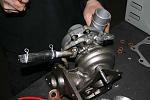 Now the old turbo was off, the new turbo could be assembled on the work bench. This requires the pipe fittings from the standard turbo (oil and water) to be transferred and fixing (using new gaskets) to the new turbo. Notice the face to the left (the two large holes), this is part of the system that is named "Twin Scroll" in effect. The gases from the headers are split in to two when delivered to the turbo via the up-pipe.
 After the turbo has been assembled with the appropriate fixings, it is then ok to refit the turbo back in to it's original place, ensuring that all fixings are reconnected. The whole process can then be reversed to fit everything back in it's rightful place.
Last edited by ex-webby; Feb 27, 2007 at 05:18 PM.
Thread Starter
Orange Club
Joined: Oct 1998
Posts: 13,763
Likes: 1
TEST 2 – As Per TEST1 plus Hybrid Turbo Dynamics Twin Scroll Turbo and remapping – Summary of Spec
Standard JDM Spec C MY03 Engine
Turbo Dynamics Hybrid Twin Scroll Turbo
K&N Panel Filter
Standard Inlet Pipe
ScoobySport Twin Scroll De-Catted Exhaust System - 3" from turbo to backbox, no resonator, straight back box design
ECUTEK remapped ECU modified from basic UK Fuel map
Uprated Actuator
3 Port Boost Solenoid
Peak Boost - 1.7bar
Fuel - Optimax
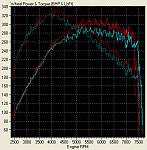
(Graphs show TEST2 and also TEST2 Vs TEST1)
TEST 2 figure achieved was 316bhp with 335lb ft torque @ THE WHEELS
TEST 2 – As Per TEST1 plus Hybrid Turbo Dynamics Twin Scroll Turbo and remapping - Comments
TEST 2 +22bhp +11lbft (peak) over TEST1
It looks like we have a winner!
As explained earlier, because we did not want to change housing sizes at this stage we knew that the peak bhp & torque figures would not be propelled in to mammoth proportions and whilst we had an increase in peak figures (remember these are only at the wheels as well), we were also able to reach a slightly higher boost and hold better boost throughout the rev range.
As you can see by the comparison graph above, this was all acheived without sacrificing lowdown response, which was key to this level of modification. From approximately 3500rpm the Turbo Dynamics Hybrid Twin Scroll started to show it's worth, giving better airflow allowing better torque figures and a much better sustained power curve.
As with any dyno plot, this only gives half of the story...... the real test would be to see the differences on the road in realtime!
Standard JDM Spec C MY03 Engine
Turbo Dynamics Hybrid Twin Scroll Turbo
K&N Panel Filter
Standard Inlet Pipe
ScoobySport Twin Scroll De-Catted Exhaust System - 3" from turbo to backbox, no resonator, straight back box design
ECUTEK remapped ECU modified from basic UK Fuel map
Uprated Actuator
3 Port Boost Solenoid
Peak Boost - 1.7bar
Fuel - Optimax
(Graphs show TEST2 and also TEST2 Vs TEST1)
TEST 2 figure achieved was 316bhp with 335lb ft torque @ THE WHEELS
TEST 2 – As Per TEST1 plus Hybrid Turbo Dynamics Twin Scroll Turbo and remapping - Comments
TEST 2 +22bhp +11lbft (peak) over TEST1
It looks like we have a winner!
As explained earlier, because we did not want to change housing sizes at this stage we knew that the peak bhp & torque figures would not be propelled in to mammoth proportions and whilst we had an increase in peak figures (remember these are only at the wheels as well), we were also able to reach a slightly higher boost and hold better boost throughout the rev range.
As you can see by the comparison graph above, this was all acheived without sacrificing lowdown response, which was key to this level of modification. From approximately 3500rpm the Turbo Dynamics Hybrid Twin Scroll started to show it's worth, giving better airflow allowing better torque figures and a much better sustained power curve.
As with any dyno plot, this only gives half of the story...... the real test would be to see the differences on the road in realtime!
Last edited by ex-webby; Feb 27, 2007 at 05:19 PM.
Thread Starter
Orange Club
Joined: Oct 1998
Posts: 13,763
Likes: 1
TEST 2 - As Per TEST1 plus Hybrid Turbo Dynamics Twin Scroll Turbo and remapping - Road Test
Upon driving the car it was evident that the previous instant kick up your backside of the standard turbo had gone. Looking at the above power graphs though, the engine power in the lower rev ranges had not dropped away, even though the driving sensation gave that feeling. When driving a car this can be a normal misconception, that after a remap (for instance) the driving feel (i.e. power delivery) is smoothed out. This tends to give the impression that power has been lost, whereas in some instances (as here) this is certainly not the case. Whilst keeping an eye on the speedo is was self evident that the car had not lost any of it’s lowdown response in reality….. this was one of the main goals achieved!
Upon acceleration from lowdown, thus maximising peak boost attainment, no hints of surge existed what so ever. Although it had been all but eradicated in Stage 1, it was ever so slightly evident still….. this had now totally disappeared and peak boost was now being attained with total control with no audible issues (concerning surge). This was further exasperated by the fact that we were now running slightly more boost as a peak value (during testing on the rolling road we could achieve 1.8bar boost with no surge) and through the rest of the rev range…. this was another main goal achieved!
The mid-range with this turbo has also been increased, as well as the top end “feel”. Before, the power had a big surge lowdown and seemed to tail off within the midrange in to the higher rev range. Now the power felt so much more constant. The term “pulls like a train” is used fairly often for description, but this certainly did feal like that with this turbo. Just when you would expect power to dip, it just keeps pulling and you have no decernable feel of power drop off within the higher rev range….. this was the final main goal achieved!
For obvious reasons you can only compare with what you previously had, but in real terms this cars powerband had not only been increased, but it also had more power to boot. All in all it has made this car even more driveable and even quicker from A to B. Because of the progressive nature of power delivery, it can be very very deceptive. Others that drove the car with its latest configuration explained that whilst the car felt quick, upon looking at the speedo they realised just how quick. This had got to the stage that I even had the speedo checked for calibration as I couldn’t believe how quick the car actually was indicated by the speedo reading. To my amazement the speedo was well within accepted tolerances and I was quite shocked to see that up to the measured 120mph we tested it to, it was only a maximum of 4% out.
True… we had not achieved massive increases in overall power, but what we had achieved was a solution that met our remit of keeping the excellent lowdown response the same with a stronger mid-range and top end. This was something that other turbo’s sold as true 400bhp twin scroll turbo’s seem to fail at providing. Ok… 400bhp would have been nice, but not at the sacrifice of the lowdown response which is such a trademark of the standard IHI twin scroll unit.
Last edited by ex-webby; Feb 27, 2007 at 05:20 PM.
Thread Starter
Orange Club
Joined: Oct 1998
Posts: 13,763
Likes: 1
TEST 3 – As Per TEST2 plus ported headers – Overview
After the success of TEST 2, it was decided to look at other cost effective ways of improving overall driveability and performance.
I had heard so much about the benefit that ported headers made, I wondered if this would make a difference to response (something worth looking at, especially since we had seemed to have solved any surge issues lowdown with the new Turbo Dynamics Hybrid Twin Scroll Turbo) and torque.
With this in mind, off I went to API to discuss what could be done. Since David at API was interested in seeing if improvements could be made to the standard twin scroll headers, it was decided we would complete some investigation and testing with API.
A majority of discussion around header porting is concerning non twin scroll headers, which are in fact cast. This basically means that the whole header unit is cast within a mould and as such the casting process means that various parts of the cast have a number of rough edges and overlaps. Just to comment on this further, gains can be made with gas flow by grindng and polishing these rough edges away to ensure optimum gas flow. Results that have been reported by several people concerning the porting of these cast headers has been rather favourable, including better response, earlier spool of turbo and better midrange.
Twin Scroll headers are some what different as instead of being cast they are infact tubular. This is a better design, as it ensures that pipes are rough edge free and by their very nature, should be better optimised for gas flow.
Since the porting process would not be as brutal as what would be done to cast headers (in the case of these headers, it would only require matching ports etc), we were not sure any great benefit would be gained.
Only one way to find out!
Note: At the same time a ScoobySport centre resonator was fitted because of issues with the straight through centre pipe currently on the car not achieving noise limits for the seasons event entry.
Last edited by ex-webby; Feb 21, 2007 at 07:17 PM.
Thread Starter
Orange Club
Joined: Oct 1998
Posts: 13,763
Likes: 1
Porting and Fitment of Headers & Up-Pipe
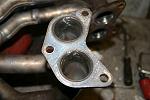
 Ok then.... a picture speaks a thousand words, so lets look at the standard twin scroll headers from the Spec C. As you can see there is a fair amount of "extra meat" around the ports, which is quite easy to see with the gasket in place. Ideally, it's this "extra meat" you want to get rid of however subtle it is.
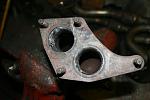
 It was now time to start the porting process. The picture to the right shows the initial stage of the porting (of the headers) and you can clearly see the amount of metal that has already been taken away from this inner edge.
 The picture opposite also shows the initial porting of the up-pipe. With the same issues as seen with the headers previously, the porting of the up-pipe required the removal of the "extra meat" around the ports.
 Unfortunately since tubular headers rely on welded joints of the various pipes lengths and ends, when taking metal away from these areas with the porting process it is normal for the ends to fall away. This is solved by re-welding the ends and then slightly grinding the inside away again. The picture opposite shows the up-pipe welded again and then having a final grind, ready for the next stage.
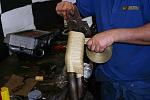 Before re-fitting the headers and up-pipe, it was recommended by API to lag all pipe work. The benefits of this is to help to keep the various pipework hot, so to aid gas flow and in theory speed
 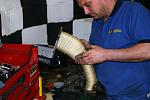 spool etc (and of course keep everything at it's optimum). With this is mind off API went to lag all the pipe work that had been ported as well as the downpipe. Whilst the wrapping is fairly easy to fit
 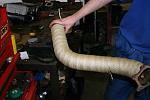 for pipework like the downpipe and up-pipe, it is slightly more complicated and time consuming for the headers. As the headers come off the car they are surrounded by heatsheilds, taking this off
 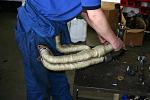 shows an array of piping that needs to be lagged individually.
Last edited by ex-webby; Feb 27, 2007 at 05:21 PM.
Thread Starter
Orange Club
Joined: Oct 1998
Posts: 13,763
Likes: 1
TEST 3 – As Per TEST2 plus ported headers – Summary of Spec
Standard JDM Spec C MY03 Engine
Turbo Dynamics Hybrid Twin Scroll Turbo
Ported Headers
K&N Panel Filter
Standard Inlet Pipe
ScoobySport Twin Scroll De-Catted Exhaust System - 3" from turbo to backbox, straight back box design
ECUTEK remapped ECU modified from basic UK Fuel map
Uprated Actuator
3 Port Boost Solenoid
Peak Boost - 1.7 bar
Fuel - Optimax
TEST 3 – As Per TEST2 plus ported headers - Comments
Unfortunately due to a PC issue at the time, I was unable to store Delta Dash – Road Dyno results for comparison. However, I was able to complete a number of Road Dyno runs (without being able to save the data).
After the time and effort involved, we were some what disappointed with the results shown in Road Dyno.
Initial spool up of the turbo had faltered somewhat, with less power and torque available lowdown. Boost achieved by previous targets had now dropped away slightly, giving some 200rpm more lag. If anything, I was expecting boost spikes and overboost, but no such issues became apparent. No other increases were apparent anywhere else in the rev range.
For this particular test, things were not looking positive.
TEST 3 – As Per TEST2 plus ported headers – Road Test
One of the immediate issues (as well as any negative driveability issues mentioned above) was that we seemed to be experiencing higher oil temps then normal. The fact that the headers / up-pipe were now lagged, meant removal of the standard heat shielding around the Spec C’s Oil Cooler couplings was required. This was the reason for higher than normal oil temps.
On the road the car certainly felt lazier, which was something that we did not want.
Unfortunately due to time factors (we were only a week away from the car needing to be ready for ScoobyNetLive) and the detrimental issues we had, we decided to replace the ported headers with the original ones. Immediately upon installation, the car returned back to it’s previous state.
With more time on our hands (probably in the future as part of another Stage of modifications) we would re-visit this test and dig deeper with investigations. Some feedback we had was that remapping was required, but initial thoughts were that surely if the porting had increased flow, we would have had increased boost and/or quicker response (that in effect we would have had to curb with mapping)…. Not lost it.
Of course it is possible, that either they were over ported (not likely) or that the standard headers are that good for this level of tune that they are best left alone.
Hopefully we would find out in the future.
Last edited by ex-webby; Feb 27, 2007 at 05:22 PM.
Thread Starter
Orange Club
Joined: Oct 1998
Posts: 13,763
Likes: 1
Engine Stage 2 – Conclusions
Well, on paper this stage has certainly seemed a lot more straight forward and less time consuming than Stage 1 did (if only)!!!
In reality this stage has been much more focused on a specific area, which in reality was primarily modifications to the turbo charger.
As TEST2 states, this was a success. However some may read the results and think “Well, that hasn’t given much increase in BHP /TORQUE and we all know turbo chargers are not cheap….. is it worth it?”. This all depends on what the individual is after. For Stage 2, we made it quiet clear that the remit was still to maintain driveability (and better it if possible), whilst trying to improve the midrange and high end rev band all for reasonable cost. Thankfully this turbo has achieved just that.
People tend to have preconceived ideas of what BHP they want, which is fine, but they must realise that higher BHP figures can have a detrimental effect on response and lowdown driveability. As mentioned earlier in this article, we already knew other hybrid twin scroll’s were available, but from feedback we had received, whilst peak figures saw around 400bhp the response and driveability had been greatly affected. For the sake of losing out on a few bhp, I was more than willing to sacrifice that for better driveability and response.
Ok.... huge increases were not apparant, but considering it was imperative that spool up and driveability where not affected, what was delivered was on the money. We saw an increase of around 15-20bhp and 10-15lbft peak, but where the differences really came in to affect was the increases over the whole rev range..... thus increasing overall driveability and the important response factor.
Since this modification stage for the engine was going to be the last for this current year (finished around May 2006), the car was being prepared for various competition events for 2006. A number of performance checks were also carried out during 2006 and this is explained and documented next within “Reality Checks for Comparison”. Needless to say, as these performance figures listed show….. this car IS rapid for it’s level of tune.
Last edited by ex-webby; Feb 21, 2007 at 07:04 PM.
Thread Starter
Orange Club
Joined: Oct 1998
Posts: 13,763
Likes: 1
Reality Checks for Comparison
As previously explained, using the different types of facilities now available to us we decided throughout the year to constantly measure the vehicles performance.
All figures and comparisons are based on the Spec C with Engine Stage 2 - TEST2 configuration. Also please remember this is a Newage, so has increased weight over a Classic shaped Subaru.
Using the RaceLogic Driftbox
0-60 3.85 seconds
0-100 9.50 seconds
Times above attained at Bruntingthorpe in 27deg ambient temps.
Using EcuTek Road Dyno
40 - 60mph = 2.0 seconds
50 - 70mph = 1.9 seconds
60 - 80mph = 2.0 seconds
70 - 90mph = 2.3 seconds
80 -100mph = 2.8 seconds
Times above ran in 4th gear.
Avon Park Drag Strip
1/4m 12.5 seconds
0-60ft 1.6 seconds
Times above in cold conditions (i.e. cold strip using cold R888 tyres) which resulted in the car wheelspinning in 1st and 2nd.
Based on the results above you will see the car can certainly shift. Admittedly it is'nt going to win any awards for it's times, but for it's level of tune and it's weight, the car is very quick. Most of the results from above were also taken during none ideal conditions. If everything came together on the day, I have no doubts that the above times could be bettered.
Sometime ago a well known glossy motoring magazine did a comparison of various Subaru modification packages available. The most powerfullest conversion was a package by one of the biggest respected Subaru tuners at the time, with a Newage car producing over 430bhp/390lbft and costing over �15k for the conversion.
For comparison that car produced the following times:
Another Tuners Newage Conversion results - 430bhp/390lbft
40 - 60mph = 3.8 seconds
50 - 70mph = 2.7 seconds
60 - 80mph = 2.3 seconds
70 - 90mph = 2.4 seconds
80 -100mph = 2.8 seconds
All taken in 4th gear.
0-60 3.90 seconds
0-100 9.40 seconds
1/4m 12.5 seconds
Again.... this clearly shows how fast the Spec C is at this modification level.
Last edited by ex-webby; Feb 27, 2007 at 05:24 PM.
Thread Starter
Orange Club
Joined: Oct 1998
Posts: 13,763
Likes: 1
Approximate Costs of Products
ScoobySport Resonator Centre Section - �190+vat
Turbo Dynamics Hybrid Twin Scroll Turbo - �500+vat (on exchange)
Ported and Lagged Twin Scroll Headers and Up-Pipe - �400+vat (on exchange)
EcuTek Delta Dash / Road Dyno Software - �215+vat
Racelogic GPS Drift Box / Performance Meter - �395+vat (or �265+vat without the drift facility)
Where do we go next?
Good question….. and one I have been thinking about ever since the end of Stage 2!
I have made some grumblings on the ScoobyNet forums and mentioned to a number of people the way (at that specific point in time) I was intending in going, but truthfully I have no idea and my mind keeps changing by the week.
I am in various discussions with a number of people about possible routes, which namely comes down to a choice from the following:
1)Big BHP – Totally new engine (either 2.33 or 2.5ltr) normal position turbo
2)Big BHP – Totally new engine (either 2.33 or 2.5ltr) rotated position turbo
3)Keep with the staged approach, trying other various modifications that are in specific areas.
Option No.3 was wiped off the list a number of months ago, but has now reappeared. This has been due to a number of “interesting possibilities” regarding turbo options that are now available to me to test.
In all honesty though I have no firm way forward at present.
What ever I decide to do though will hopefully be finished over Autumn / Winter, in readiness for next season and also for a spring publication on ScoobyNet as Engine Modifications – Stage 3!!
Last edited by ex-webby; Feb 21, 2007 at 07:32 PM.
Thread Starter
Orange Club
Joined: Oct 1998
Posts: 13,763
Likes: 1
Thanks
Huge thanks goes to the mentioned companies for their involvement, expertise and supply of products/services for this article over the past 6 months.
Contact Details:
Powerstation
Northway Trading Estate
Northway Lane
Tewkesbury
Gloucestershire
GL20 8JH
+44 (0)1684 296675
email@powerstation.org.uk
ScoobySport
enquiries@scoobysport.com
Litchfield Imports
Northway Trading Estate
Northway Lane
Tewkesbury
Gloucestershire
GL20 8JH
+44 (0)1684 850999
sales@litimports.co.uk
API Impreza
3 & 4 Churchlands Farm Ind. Est.
Bascote Road
Harbury
Warwickshire
CV33 9PL
Sales +44 (0)1926 614333
General Enquiries +44 (0)1926 614522
dob@apiengines.com
Turbo Dynamics
Units 20 & 21
Somerford Business Park
Wilverley Road
Christchurch
Dorset
BH23 3RU
+44 (0)1202 487497
sales@turbodynamics.co.uk
ECUTEK
7 Union Buildings
Wallingford Road
Uxbridge
UB8 2FR
+44 (0)1895 811200
sales@ecutek.com
Racelogic
5 Little Balmer
Buckingham Industrial Park
Buckingham
MK18 1TF
+44 (0)1280 823595
sales@racelogic.co.uk
Last edited by ex-webby; Feb 21, 2007 at 07:55 PM.

Thread
Thread Starter
Forum
Replies
Last Post
Mattybr5@MB Developments
Full Cars Breaking For Spares
28
Dec 28, 2015 11:07 PM