
So just when will this stop? (rant mode on)
 31 July 2007, 12:26 PM
#1
Scooby Regular
Thread Starter
iTrader: (3)

Join Date: Aug 2004
Location: Muppetising life
Posts: 15,449
Likes: 0
Received 0 Likes
on
0 Posts
I've been a member of this board for a while now. I have seen a fair few power charts posted up in various section of the forum, but the claims just keep getting worse.
I saw a graph the other day that finally did it for me The apparent claims are just ridiculous. All that matters is the power your wheels put to the road. Anything else is just a pointless claim that may or may not be correct.
In the past people went to a rolling road and got a figure that was much lower than the manufacturers quoted for your engine. We understand why this is, but people wanted to get a nice large fly wheel power figure. So companies started out with assuming 25% transmission losses, and now we have this graph showing 44%. Less than 200bhp at the wheels, but with the engine supposedly making circa 340bhp. Car was a Newage JDM STI, that is either very sick, or the rollers were on a bad day.
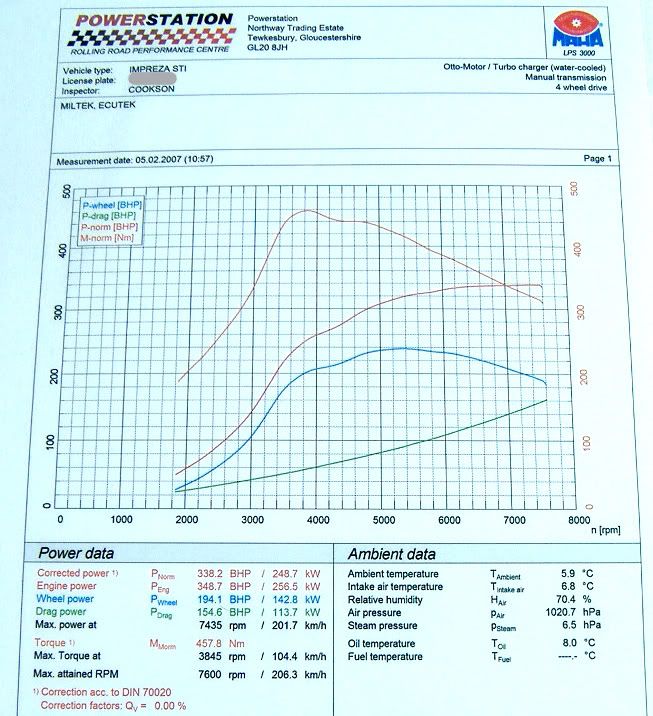
Just when is this going to stop? How about I take my classic for a powergraph and assume losses of 55% as its older. That will make it look good right? I think we as a community need to take a stand and stop wittering on about flywheel bhp. The EVO community have managed, are they so much better than us? Wheel bhp is what we should talk about, it will really help reduce any false claims, and is the proper indication of performance. As a community if we don't help educate our members this kind of rubbish is just going to continue
Now I need to add that I neither know the member who posted his graph, or have been to the company that made it. I have no person beef with either. My motives are to help the community as a whole. Please, don't bother to tell me how amazingly accurate certain rolling roads are. None manage to get fly wheel bhp accurate to one decimal point.
Anyone with a standard STI want to post up some graphs showing what transmission losses you "need to have" to get the factory quoted figure? I bet its not 44% or close to that (from what I have seen its around 25-30%)
Please note this is not intended to be another transmission loss can of worms thread. This is a thread about closing that can for good. Lets just talk about whp.
I saw a graph the other day that finally did it for me
The apparent claims are just ridiculous. All that matters is the power your wheels put to the road. Anything else is just a pointless claim that may or may not be correct.In the past people went to a rolling road and got a figure that was much lower than the manufacturers quoted for your engine. We understand why this is, but people wanted to get a nice large fly wheel power figure. So companies started out with assuming 25% transmission losses, and now we have this graph showing 44%. Less than 200bhp at the wheels, but with the engine supposedly making circa 340bhp. Car was a Newage JDM STI, that is either very sick, or the rollers were on a bad day.
Just when is this going to stop? How about I take my classic for a powergraph and assume losses of 55% as its older. That will make it look good right? I think we as a community need to take a stand and stop wittering on about flywheel bhp. The EVO community have managed, are they so much better than us? Wheel bhp is what we should talk about, it will really help reduce any false claims, and is the proper indication of performance. As a community if we don't help educate our members this kind of rubbish is just going to continue
Now I need to add that I neither know the member who posted his graph, or have been to the company that made it. I have no person beef with either. My motives are to help the community as a whole. Please, don't bother to tell me how amazingly accurate certain rolling roads are. None manage to get fly wheel bhp accurate to one decimal point.
Anyone with a standard STI want to post up some graphs showing what transmission losses you "need to have" to get the factory quoted figure? I bet its not 44% or close to that (from what I have seen its around 25-30%)
Please note this is not intended to be another transmission loss can of worms thread. This is a thread about closing that can for good. Lets just talk about whp.
 31 July 2007, 12:30 PM
#2
Scooby Regular

Join Date: Apr 2007
Posts: 133
Likes: 0
Received 0 Likes
on
0 Posts
rr rsults are good for 2 things. first they show how well a mod is working with a before and after figure on the same rollers and second to help find problems with sick cars. thats all. it all comes down to the way the car drives on the road in real life that counts not figures guess'd on a machine wich to be fair will change every time..
31 July 2007, 12:34 PM
#3
Scooby Regular
Thread Starter
iTrader: (3)
Join Date: Aug 2004
Location: Muppetising life
Posts: 15,449
Likes: 0
Received 0 Likes
on
0 Posts
Yup, both good points. You are right, that is all that really counts. However, it is nice to communicate what sort of power is putting out, and we could do with a more reliable method than trying to quote flywheel bhp. I do know that a lot of these companies spend a lot of time and effort to try and make their fly figures accurate, but it does not always work. Just look at that one above 
31 July 2007, 12:38 PM
#4
Scooby Regular

Join Date: Apr 2007
Posts: 318
Likes: 0
Received 0 Likes
on
0 Posts
you forgot the 3rd thing they are good for....***** waving down the pub to your mates.
Sorry, felt I needed to lighten the thread a wee bit. I agree, I know the last time I had a car rr'd I was told by the operator that they key in garage humidity, temeperature etc at the start of the day and the software tries to even out a standard to try and stop the "But it was a hot day comments". If all do this I dont know.
As per amazing james comments when I had mine done (not the scooby) it showed a fault which the manufacturer took on board because of the evidence so it got the problem resolved.
31 July 2007, 12:39 PM
#5
Scooby Regular

Join Date: Apr 2000
Posts: 1,054
Likes: 0
Received 0 Likes
on
0 Posts
I remember, on that same RR, watching a 'well modded' GTiR make over 300bhp to lots of whooping and shouting. Shame it was only putting 175bhp of it actually down to the wheels...
31 July 2007, 12:41 PM
#6
Scooby Regular
Join Date: Apr 2000
Posts: 1,054
Likes: 0
Received 0 Likes
on
0 Posts
I put my car on one set of rollers on a boiling hot July day when it was something like 30+C outside, and got one figure. 6 months later with snow falling and without having changed anything, I put it on another set of rollers and got a figure 10bhp lower - didn't bother me though as it was close enough. Anything less than about 20-odd bhp between rollers is just margin of error IMO.
31 July 2007, 12:49 PM
#7
Scooby Regular

Join Date: Jun 2006
Location: Edinburgh (ish)
Posts: 8,089
Likes: 0
Received 0 Likes
on
0 Posts
My car (view my Scooby) produced 258bhp atw at Dastek in Fife, which translated to 301bhp at the flywheel.
Andy F gave the following comment in an earlier thread re the minimal transmission losses used in the calculation :
"The load on the rollers during the rundown is used in a calculation to generate a drag or loss curve which is added to the measured figure (wheel) to give a flywheel power. It is more accurate in my opinion than just a 'one fits all' style addition as used by some other rollers."
Trending Topics
31 July 2007, 12:52 PM
#8
Scooby Regular
iTrader: (1)

Join Date: Feb 2006
Location: Warwickshire, UK
Posts: 2,099
Likes: 0
Received 0 Likes
on
0 Posts
A Friend of mine attended a dyno shootout at a well know dyno/tuning shop when he was into 4WD Celica's, they were offering a unichip fit remap on the day for a special rate, my mate watched the dyno operator change the wheel loss figure (we work on dyno's 'a bit') whilst they were doing the remapping, the guy ended up with an alleged 30bhp increase (215 to 245) on an ST205 (stock about 237) my mate had already been very suspicious of the low output on his, especially when being told that 'we can get that back to better than stock with a Unichip mate'.
Funnily he declined!
Simon
Funnily he declined!
Simon
31 July 2007, 02:31 PM
#9
Scooby Regular
Thread Starter
iTrader: (3)
Join Date: Aug 2004
Location: Muppetising life
Posts: 15,449
Likes: 0
Received 0 Likes
on
0 Posts
A Friend of mine attended a dyno shootout at a well know dyno/tuning shop when he was into 4WD Celica's, they were offering a unichip fit remap on the day for a special rate, my mate watched the dyno operator change the wheel loss figure (we work on dyno's 'a bit') whilst they were doing the remapping, the guy ended up with an alleged 30bhp increase (215 to 245) on an ST205 (stock about 237) my mate had already been very suspicious of the low output on his, especially when being told that 'we can get that back to better than stock with a Unichip mate'.
Funnily he declined!
Simon
Funnily he declined!
Simon
31 July 2007, 03:10 PM
#10
Scooby Regular

Join Date: May 2007
Location: surrey
Posts: 160
Likes: 0
Received 0 Likes
on
0 Posts
i agree totally to all the above.
can i give you a analagy, that works for me.
a 100 meter runner (like lynford christie) can put times/performance down on a tread mill in a clinical enviroment, with doctors/technitions monitering him, with wind/conditions entered...and obtain certain results/best times etc, these "results" cannot be replicated out on the track, as there are so many variables.
this is the same for your car, clinical conditions will not equate to driving on the road (bhp figures) my car drives differently one day to the next, what difference does BHP figures make to the "normal subaru guy"
2 STI's one 300 bhp, one 350 bhp, and the 300 car "could" be far quicker,
rolling roads dont take into consideration "YOU" or your gearbox etc.
i understand people want to "see" if a certain mod has improved the car, but come on, do figures rearly matter?
its what it does that counts.
31 July 2007, 03:19 PM
#12
Scooby Regular
![[Davey]'s Avatar](data:image/svg+xml;utf8,<svg xmlns='http://www.w3.org/2000/svg' viewBox='0 0 50 50'><circle class='avatar-circle-default' fill='%23806b84' cx='25px' cy='25px' r='20px'></circle><text class='avatar-text-default' x='49%' y='53%' fill='white' text-anchor='middle' alignment-baseline='middle'>[</text></svg>)
i
a 100 meter runner (like lynford christie) can put times/performance down on a tread mill in a clinical enviroment, with doctors/technitions monitering him, with wind/conditions entered...and obtain certain results/best times etc, these "results" cannot be replicated out on the track, as there are so many variables.
this is the same for your car, clinical conditions will not equate to driving on the road (bhp figures) .
31 July 2007, 04:05 PM
#13
Scooby Regular
iTrader: (3)
Join Date: Aug 2000
Location: 1600cc's of twin scroll fun :)
Posts: 25,565
Likes: 0
Received 2 Likes
on
2 Posts
25% is a bit steep, 15 is more likely  my last scoob was around 17-18% in most cases, but you have to look at several factors, tyres, pressures etc which can increase drag (wider the tyre, the more drag the lower the transmission figures) yet on the road when your outpacing cars not much heavier (and not 4wd) with more power it makes you think, are these whp figures actually total bs?
Tony
my last scoob was around 17-18% in most cases, but you have to look at several factors, tyres, pressures etc which can increase drag (wider the tyre, the more drag the lower the transmission figures) yet on the road when your outpacing cars not much heavier (and not 4wd) with more power it makes you think, are these whp figures actually total bs?Tony
31 July 2007, 04:09 PM
#14
Scooby Regular
Join Date: May 2007
Location: surrey
Posts: 160
Likes: 0
Received 0 Likes
on
0 Posts
 31 July 2007, 04:25 PM
#15
Scooby Regular
iTrader: (1)
Join Date: Feb 2006
Location: Warwickshire, UK
Posts: 2,099
Likes: 0
Received 0 Likes
on
0 Posts
25% is a bit steep, 15 is more likely my last scoob was around 17-18% in most cases, but you have to look at several factors, tyres, pressures etc which can increase drag (wider the tyre, the more drag the lower the transmission figures) yet on the road when your outpacing cars not much heavier (and not 4wd) with more power it makes you think, are these whp figures actually total bs?
Tony
my last scoob was around 17-18% in most cases, but you have to look at several factors, tyres, pressures etc which can increase drag (wider the tyre, the more drag the lower the transmission figures) yet on the road when your outpacing cars not much heavier (and not 4wd) with more power it makes you think, are these whp figures actually total bs?Tony
But then drag loss is unrepresentative as obviouslymore power means more friction due to incraesed loadings on bearings and gears, yet the drag loss measurement won't change!
Simon

 31 July 2007, 11:56 PM
#17
Scooby Regular
Join Date: Sep 2006
Posts: 1,976
Likes: 0
Received 0 Likes
on
0 Posts
I read somewhere on here that PS's rollers are also supposed to take into account things like rolling resistance and wind resistance, and the figure they give you is supposedly calculated as what you would feel as the driver. I'll try and find the thread, as I remember posting in it.
01 August 2007, 12:00 AM
#18
Scooby Regular
Join Date: Dec 2002
Location: Couch Spud
Posts: 9,277
Likes: 0
Received 0 Likes
on
0 Posts
I have seen one, and indeed have it on Video too
A WRX Bugeye hitting 450-500bhp on the rollers that was very poorly, and the power was about 80% front wheels, 20% rear wheels (not a std bugeye though )
Not quite sure if the diff had gone, but certainly the rear wheels stopped spinning quite some time before the front wheels, was pretty much the same result for both runs that were done
The same car with no 3rd gear still managed an impressive run down the strip at Santa Pod
A WRX Bugeye hitting 450-500bhp on the rollers that was very poorly, and the power was about 80% front wheels, 20% rear wheels (not a std bugeye though
)Not quite sure if the diff had gone, but certainly the rear wheels stopped spinning quite some time before the front wheels, was pretty much the same result for both runs that were done
The same car with no 3rd gear still managed an impressive run down the strip at Santa Pod
01 August 2007, 12:11 AM
#19
Scooby Regular
Join Date: Dec 2002
Location: Couch Spud
Posts: 9,277
Likes: 0
Received 0 Likes
on
0 Posts
I have seen one, and indeed have it on Video too
A WRX Bugeye hitting 450-500bhp on the rollers that was very poorly, and the power was about 80% front wheels, 20% rear wheels (not a std bugeye though )
Not quite sure if the diff had gone, but certainly the rear wheels stopped spinning quite some time before the front wheels, was pretty much the same result for both runs that were done
The same car with no 3rd gear still managed an impressive run down the strip at Santa Pod
A WRX Bugeye hitting 450-500bhp on the rollers that was very poorly, and the power was about 80% front wheels, 20% rear wheels (not a std bugeye though
)Not quite sure if the diff had gone, but certainly the rear wheels stopped spinning quite some time before the front wheels, was pretty much the same result for both runs that were done
The same car with no 3rd gear still managed an impressive run down the strip at Santa Pod
01 August 2007, 12:28 AM
#20
Scooby Regular

Join Date: Jul 2002
Location: Under your bonnet
Posts: 9,173
Likes: 0
Received 0 Likes
on
0 Posts
Ah this old chestnut again ")
The drag figures are irrelevant on that type of dyno, forget even looking at them.
You go from those energy saving tyres to slicks and watch your transmission losses double...
Funny how the BHP stays the same though.
Andy F put it well
The load on the rollers during the rundown is used in a calculation to generate a drag or loss curve which is added to the measured figure (wheel) to give a flywheel power. It is more accurate in my opinion (maha) than just a 'one fits all' style addition as used by some other rollers.(Dyno Dynamics for eg)"
Andy
The drag figures are irrelevant on that type of dyno, forget even looking at them.
You go from those energy saving tyres to slicks and watch your transmission losses double...
Funny how the BHP stays the same though.
Andy F put it well
The load on the rollers during the rundown is used in a calculation to generate a drag or loss curve which is added to the measured figure (wheel) to give a flywheel power. It is more accurate in my opinion (maha
) than just a 'one fits all' style addition as used by some other rollers.(Dyno Dynamics for eg)"Andy
01 August 2007, 01:18 AM
#21
Scooby Regular

Join Date: May 2004
Location: Ascended to the next level
Posts: 7,498
Likes: 0
Received 0 Likes
on
0 Posts
In the end of the day BHP is totally irrelevant...wheels or fly 
Remember BHP = Torque x rpm / 5252
That being Torque is the important factor in here....that's what you feel when the turbo kicks in and thats what cuases that steep rise in bhp at 3000ish rpm.
And if the torque/bhp plots don't cross at 5252rpm when used on the same scale, it's been fiddled, or the scales have been changed to make the graph look better.
I think one RR session summed it up when setting up a set of webbers on a 1.6 CVH Ford to compensate for a new big valve cylinder head. Ended up with a nice 130bhp at the wheels, not bad. However, drove the car on the road...it was awful, spitting out the chokes, hesitating and as flat as a pancake. Out comes me, a few screwdrivers dusted off the old crypton to reset the base idle (seeing that it was so rich it fouled the plugs), then proceeded to tune the car for the real world- on the road. Not sure what BHP it pulled after that, but it went a hell of alot better than it ever did on the RR tune. Obviously thats down to the tuner, but seeing the place dealt and specialised in webbers and were pretty familiar with CVHs, you'd think they'd have got it right, eh?
As said, they are only good for comparing before and after plots on the same car, on the same rollers during the same tempertures and same humidity, making sure its running right and possibly getting the basic tweaking sorted before finalising a setup on the road.
Last edited by Shark Man; 01 August 2007 at 01:21 AM.
01 August 2007, 07:29 AM
#22

Been a very long time since i read power = torque x rpm.
Last time I said that on here i was shot down.
Where does '5252' come from please?
I also think RR's are a snapshot of the moment.
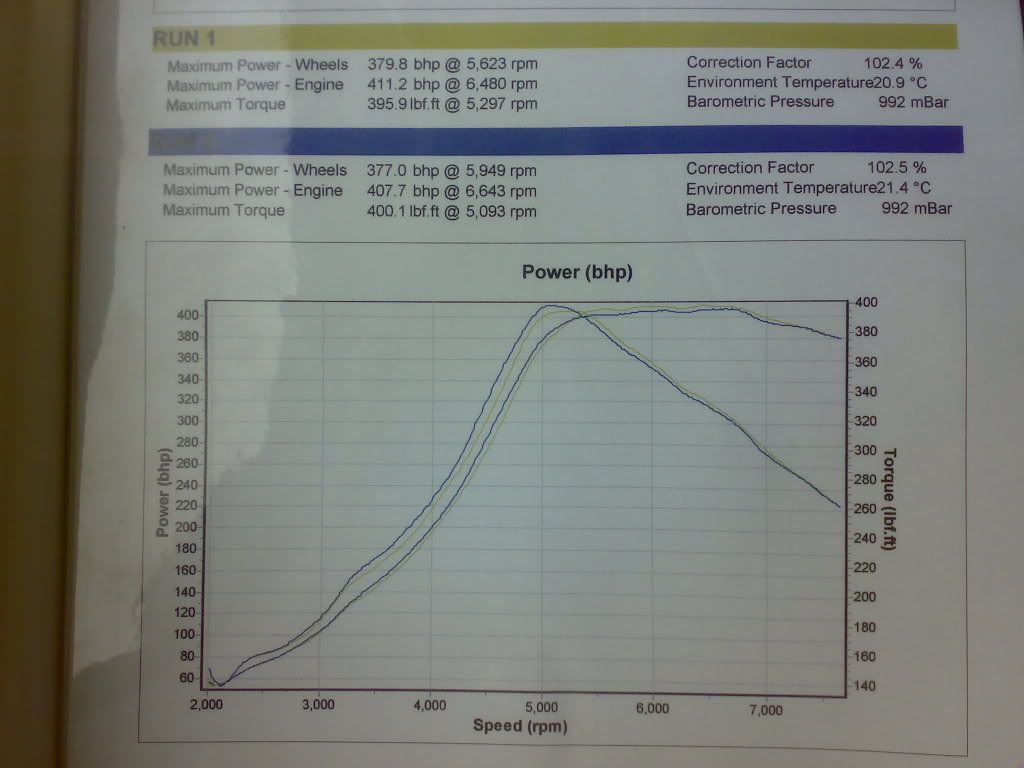
My Sti V3 did 407 bhp on a very cold and humid day at Well Lane.
4 months later at Power Station on a warm dry day, 378 bhp.
I'm not sure the car performance is repeatable to any degree of accuracy, especially when the power runs are even 15 minutes apart due to heating of TMIC etc.
Graham.
Last time I said that on here i was shot down.
Where does '5252' come from please?
I also think RR's are a snapshot of the moment.
My Sti V3 did 407 bhp on a very cold and humid day at Well Lane.
4 months later at Power Station on a warm dry day, 378 bhp.
I'm not sure the car performance is repeatable to any degree of accuracy, especially when the power runs are even 15 minutes apart due to heating of TMIC etc.
Graham.
01 August 2007, 07:58 AM
#23
Scooby Regular

Laughable if you ask me , you would lose more than 7.5 % on a car with 90hp never mind one with 400...
Also quite interested in how the maximum power is reached at a different rpm at the wheels than it is at the flywheel...?
01 August 2007, 08:15 AM
#24
Scooby Regular

Join Date: Sep 2000
Posts: 1,081
Likes: 0
Received 0 Likes
on
0 Posts
The 'flywheel' numbers on Powerstation's Maha dyno are, in my experience, quite similar or slightly less than the 'flywheel' numbers on a Dyno Dynamics dyno. The Maha dyno works differently to the others, don't forget the 'drag power' it is measuring is for the dyno as well as the car, tyres and transmission, and isn't a fixed percentage. Powerstation's numbers are usually quite conservative.
If it didn't show the 'drag' at all then would people be happier ?
If it didn't show the 'drag' at all then would people be happier ?
 01 August 2007, 08:54 AM
#26
Scooby Regular
iTrader: (1)

Join Date: Jan 1999
Location: UK
Posts: 15,271
Likes: 0
Received 0 Likes
on
0 Posts
I've been a member of this board for a while now. I have seen a fair few power charts posted up in various section of the forum, but the claims just keep getting worse.
I saw a graph the other day that finally did it for me The apparent claims are just ridiculous. All that matters is the power your wheels put to the road. Anything else is just a pointless claim that may or may not be correct.
In the past people went to a rolling road and got a figure that was much lower than the manufacturers quoted for your engine. We understand why this is, but people wanted to get a nice large fly wheel power figure. So companies started out with assuming 25% transmission losses, and now we have this graph showing 44%. Less than 200bhp at the wheels, but with the engine supposedly making circa 340bhp. Car was a Newage JDM STI, that is either very sick, or the rollers were on a bad day.
Just when is this going to stop? How about I take my classic for a powergraph and assume losses of 55% as its older. That will make it look good right? I think we as a community need to take a stand and stop wittering on about flywheel bhp. The EVO community have managed, are they so much better than us? Wheel bhp is what we should talk about, it will really help reduce any false claims, and is the proper indication of performance. As a community if we don't help educate our members this kind of rubbish is just going to continue
Now I need to add that I neither know the member who posted his graph, or have been to the company that made it. I have no person beef with either. My motives are to help the community as a whole. Please, don't bother to tell me how amazingly accurate certain rolling roads are. None manage to get fly wheel bhp accurate to one decimal point.
Anyone with a standard STI want to post up some graphs showing what transmission losses you "need to have" to get the factory quoted figure? I bet its not 44% or close to that (from what I have seen its around 25-30%)
Please note this is not intended to be another transmission loss can of worms thread. This is a thread about closing that can for good. Lets just talk about whp.
I saw a graph the other day that finally did it for me
The apparent claims are just ridiculous. All that matters is the power your wheels put to the road. Anything else is just a pointless claim that may or may not be correct.In the past people went to a rolling road and got a figure that was much lower than the manufacturers quoted for your engine. We understand why this is, but people wanted to get a nice large fly wheel power figure. So companies started out with assuming 25% transmission losses, and now we have this graph showing 44%. Less than 200bhp at the wheels, but with the engine supposedly making circa 340bhp. Car was a Newage JDM STI, that is either very sick, or the rollers were on a bad day.
Just when is this going to stop? How about I take my classic for a powergraph and assume losses of 55% as its older. That will make it look good right? I think we as a community need to take a stand and stop wittering on about flywheel bhp. The EVO community have managed, are they so much better than us? Wheel bhp is what we should talk about, it will really help reduce any false claims, and is the proper indication of performance. As a community if we don't help educate our members this kind of rubbish is just going to continue
Now I need to add that I neither know the member who posted his graph, or have been to the company that made it. I have no person beef with either. My motives are to help the community as a whole. Please, don't bother to tell me how amazingly accurate certain rolling roads are. None manage to get fly wheel bhp accurate to one decimal point.
Anyone with a standard STI want to post up some graphs showing what transmission losses you "need to have" to get the factory quoted figure? I bet its not 44% or close to that (from what I have seen its around 25-30%)
Please note this is not intended to be another transmission loss can of worms thread. This is a thread about closing that can for good. Lets just talk about whp.
On this RR if the car had been run with three different tyre pressures - say 10, 30 and 50 PSI you would have got three completely different at the wheel BHP figures.
So tell us which one would have been correct?
Other factors affecting this are wheel alignment, tyre type, tyre age, whether the rollers had been sprayed...and so the list goes on. All factors affecting wheel bhp.
BTW the flywheel figures would have worked out to be pretty much the same. If you want clarity on this speak to Merv (now Ecutek) as he tried this very experiment at Power Engineering to demonstrate the misleading nature of the argument you make.
You will not be able to put this argument to bed with the assertions that you make.
Last edited by Trout; 01 August 2007 at 09:17 AM.
 01 August 2007, 11:20 AM
#29
Scooby Regular
Join Date: May 2004
Location: Ascended to the next level
Posts: 7,498
Likes: 0
Received 0 Likes
on
0 Posts
Basics first:
Torque = FR, where F is the force in lbs and R is the length of the moment arm in ft. This rotational effort
Otherwise known as:
Work = FS, where F is the force in lbs and S is the displacement in ft. This is effort in a straight line.
Another rule: Power = Work Done/Time (in minutes in our case)
So, rearraging the above gives us:
Code:
Power=   Force * Distance
          ----------------
                Time
Remember that, we'll need it later:
Now it is known that 1HP = 550lbs at a rate of 1ft per second ( the amount of work one horse can do). I should point out that 1 metric HP = 0.986320406 HP, but for simplicity, call it 1
Seeing we need minutes not seconds (RPM) we multiply that by 60 to get 1BHP = 33000 ft-lbs/min
Because the engine rotates, rather than travels a distance, we need our friend PI (mmm Piiiiii). So multiply the torque by 2 * PI * RPM (engine speed).
This gives us:
Code:
FORCE* 2 * PI * REVOLUTIONS
-----------------------------
          TIME (mins)
Obviously, this is still Torque - i.e ft-lbs per minute. We want BHP, so we need to divide by 33000 (1 horse is equal to 33000ft-lbs/min):
Code:
Torque * 2 * PI * RPM
----------------------
       33000

Simplify and rearrage the equation:

Torque * RPM
-------------
33000/(2*PI)

Resolve the bottom line, as we already know what that is:

Torque * RPM
-------------
   5252
)
Last edited by Shark Man; 01 August 2007 at 11:25 AM.