
Gold - just how high will it go


Scooby Regular
Joined: Jan 2001
Posts: 9,781
Likes: 0
1. Defaults on a massive global scale, new currencies (gold will rocket)
2. Inflation, which is very hard to keep a lid on once it starts (gold will rocket)
The only risk is that holding gold may be made illegal again, so take precautions


Scooby Regular
Joined: Jun 2005
Posts: 4,495
Likes: 0
From: Shell petrol station

Scooby Regular
Joined: Mar 2010
Posts: 10,329
Likes: 0
Scooby Regular
Joined: Jun 2005
Posts: 4,495
Likes: 0
From: Shell petrol station
DISCLAIMER: NOT ADVICE Do your own research!
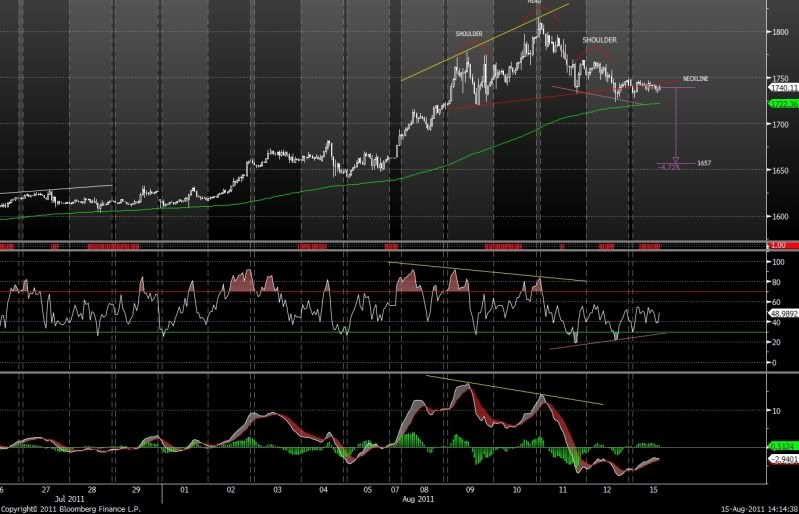
Above chart is 60min chart of gold.
1) I can see a head and shoulder reversal formation (the red arcs and red trend line) which is activated on the breakdown of the neckline. Usually a safer entry to this trade would be to wait for the violation of the trend line and look to short gold on the retest of it.
2) The yellow line shows gold making a higher high, however the yellow lines on the RSI and MACD are making lower highs, this is what is called bearish divergence, and signals weakness and pending trend reversal.
3) There is also some bullish divergence of price vs RSI which is counter intuitive to a bearish view (the pink line on the 11th and 12th), however with this short term bullish signal there has seemingly been no follow through which i read again as continued weakness in relation to prior strength.
4) A measured move targets 1657.
5) On the daily chart from the July low to Aug high, the 50% fib retracement targets 1646, if we look back to the 60min chart, specifically 3rd,4th and 5th, we can see that there is congestion around the 1640-80 level, so all of are targets suggest a move towards this area of congestion and seeing how gold consolidated at these prices it is reasonable to assume there will be some support here.
6) The right hand shoulder on the 60min has a high of 1769.5 and the left shoulder has highs of 1779, so if gold takes out these levels it would invalidate the reversal formation
7) The bollinger bands trade inside the keltner channels, indicating a relative lower level of volatility. Usually a precursor to an explosive move. Signal has not yet fired off but in the context of everything else the picture is telling us my intuition suggest that move, when it comes, takes us lower.
8) A close below 1732 (the low of the high day, 11th Aug) would really get me salivating at making some money short gold.....this is yet to happen.
Scooby Regular
Joined: Mar 2010
Posts: 10,329
Likes: 0
Sorry retarded question: is the RSI going up to 0.7 a buy signal? I thought it mean overbought for some reason?
What is the purple? Is that your new down trend line in theory? Are you talking about it being safer to wait for gold to puncture this line or the red one before shorting the rebound?
Thanks for your analysis BTW, very interesting. I'm using Google to find out what half of it means.
What is the purple? Is that your new down trend line in theory? Are you talking about it being safer to wait for gold to puncture this line or the red one before shorting the rebound?
Thanks for your analysis BTW, very interesting. I'm using Google to find out what half of it means.
Last edited by tony de wonderful; Aug 15, 2011 at 03:18 PM.
Scooby Regular
Joined: Jun 2005
Posts: 4,495
Likes: 0
From: Shell petrol station
I disregard the use of oscillators to highlight overbought and oversold, markets can remain in these states for months even years so it has little use to me.
The purple line is not a trend line, it just serves to highlight how the market made a lower low but the RSI made a higher high, which is bullish divergence.
The redline, which i have titled "neckline" is the line you look to see gold break and then retest to enter on a more conservative tack.
The purple line is not a trend line, it just serves to highlight how the market made a lower low but the RSI made a higher high, which is bullish divergence.
The redline, which i have titled "neckline" is the line you look to see gold break and then retest to enter on a more conservative tack.

 .
.
Scooby Regular
Joined: Dec 2007
Posts: 6,284
Likes: 4
From: Scotland
IIRC he had a pretty substantial long position as recently as July?
Scooby Regular
Joined: Dec 2007
Posts: 6,284
Likes: 4
From: Scotland
It does make sense that there will be some kind of correction now. Things seem to be settling down, there isn't so much volatility, that statement by the Fed having had the effect they intended.
With the structural economic problems that the west faces and the political 'solutions' which are so far being used, it's actually not a long shot to imagine this just being the beginning of one massive bubble that might culminate with quite a lot of the general public buying gold in one way or other.
With the structural economic problems that the west faces and the political 'solutions' which are so far being used, it's actually not a long shot to imagine this just being the beginning of one massive bubble that might culminate with quite a lot of the general public buying gold in one way or other.
Last edited by GlesgaKiss; Aug 15, 2011 at 06:24 PM.
Scooby Regular
Joined: Mar 2010
Posts: 10,329
Likes: 0
It does make sense that there will be some kind of correction now. Things seem to be settling down, there isn't so much volatility, that statement by the Fed having had the effect they intended.
With the structural economic problems that the west faces and the political 'solutions' which are so far being used, it's actually not a long shot to imagine this just being the beginning of one massive bubble that might culminate with quite a lot of the general public buying gold in one way or other.
With the structural economic problems that the west faces and the political 'solutions' which are so far being used, it's actually not a long shot to imagine this just being the beginning of one massive bubble that might culminate with quite a lot of the general public buying gold in one way or other.
Scooby Regular
Joined: Dec 2007
Posts: 6,284
Likes: 4
From: Scotland
But yes, in terms of the investment community, it seems it's no longer the minority view to be expecting inflation and owning gold to hedge against it.
Even amongst those big players, it's surely not bubble status yet. Wait till the end of QE3, QE4. Depending on the nature of monetary policy from here on, this has the potential to be massive. I just can't see what event could trigger the sell off and result in a bear market right now.

Scooby Regular
Joined: Mar 2010
Posts: 10,329
Likes: 0
Hi Alloy. What's the best way to access similar data and the tools you have there....without paying a fortune? 
Gold at 1779 last check. Looks like it invalidates the thing you were on about? Choppy trading for a while?
Gold at 1779 last check. Looks like it invalidates the thing you were on about? Choppy trading for a while?
Last edited by tony de wonderful; Aug 16, 2011 at 01:59 PM.
Scooby Regular
Joined: Jun 2005
Posts: 4,495
Likes: 0
From: Shell petrol station
Any charting software will be able to mostly replicate that data....any of the spreadbetters/CFD providers etc offer free charting programs with their accounts

Scooby Regular
Joined: Dec 2007
Posts: 6,284
Likes: 4
From: Scotland
Tony - IG index free charts are not bad. But there is - or at least used to be - an advanced charting service which you paid a little every month for. They were decent, but still not Bloomberg quality!
Scooby Regular
Joined: Jun 2005
Posts: 4,495
Likes: 0
From: Shell petrol station
That doesn't mean there isnt trade opportunities, it just means directional one way positioning is high risk, hence why if im short gold i'm long platinum to net off that risk and stay hedged
In the US there is a great PC tool called Telechart by Worden - good for the amateur.
Not sure if there is anything similar here.
Telechart makes it very easy to compare stocks and find stocks that meet your pattern - you can simply scroll through your selection in a fraction of a second by hitting space. If you are looking for specific patterns it means you can filter hundreds of stocks in an hour.


Scooby Regular
Joined: Jun 2005
Posts: 4,495
Likes: 0
From: Shell petrol station

