RS3 8V: One step at a time
 14 August 2016, 02:36 PM
#1
Scooby Regular

Thread Starter
**Sorry guys - again this is being posted on other (Audi) forums, so hence the intro. Real meat will commence shortly, so apologies for the rice!"
Anyone that knows of me via my previous Subaru and A45 project threads will appreciate I like to delve that little bit deeper with my project threads, at least in respect of the kind of testing and information I like to gather and share. I aim to ensure this RS3 project thread is no different.
What I aim to do is go into detail about what�s being done, why it�s being done and be utterly truthful about the results, supported by as much evidence as possible. I�m not going to state I�m looking to reinvent the wheel, but there is no harm in aiming to make a wheel better! I�m quite excited with the potential development areas that could be investigated.
I�m a �privateer� and enthusiast, so have nothing to gain from this�� other than I absolutely love doing this kind of thing, and love to learn and experience new things. If at least one other person finds this project interesting�� that�s a mega bonus!
My previous performance car was an AMG A45, which after going through a modification project, ended up being the quickest A45 down the drag strip in the UK. Didn�t break any �real drag� records, but it achieved a decent time of 11.80s. Not bad considering it was a hatch with pretty basic levels of tuning.
So� A45 move over. Here�s the RS3!
Why did I swap out for an RS3 then?
Being totally honest�.. the limited tuning available for the A45, with the Achilles heel being the transmission.
I went out and bought an RS3, pretty much fully loaded�� the kicker being that based on what has already been done with the 2.5 engine, pretty extensive levels of tuning are available. Just up my road then! Lol
Approach - Project Roadmap
Obviously I can�t do this on my own, as the amount of resources needed to do this kind of project approach justice, is more than my brain, skill and hands can cope with. So I�ll be working with a number of �professionals� along the way, but more on that once we get things underway.
The areas I would like to cover/investigate are (we�ll have to see if all these come to fruition - although certain areas have already been discussed with the individual's I�ll be working with):
Tuning Box
Secondary Decat pipes
ECU remap
Uprated plugs
Look at intercooler and inlet efficiencies at this level, look at testing upgrades if warranted
Turbo (along with remap and again looking at intercooler and inlet efficiencies).
End target is at least 500bhp - ideally looking to get in the 10�s down the strip, but this will probably need quite a bit more than 500bhp - we�ll see how this all goes.
This is all very very high level, but gives an idea of the kind of steps I�ll be looking to take. Depending upon how the car reacts, I may look at chassis / suspension / braking mods. I will also be undertaking some subtle styling mods... just to jazz things up a touch. Nothing too "Halfords" though.... don't worry!
So�. that�s enough of the introductory stuff.
The next update will be coming your way soon - so let the fun begin guys. First round of performance mods and testing will be starting at the end of August.
I really hope (and encourage) for you all to get stuck in and feel free to contribute to this open discussion thread.
 14 August 2016, 05:37 PM
#2
Scooby Regular
Thread Starter
Styling Mods
So before we delve into the performance side of things I thought I would make a start with completing a few subtle styling mods.
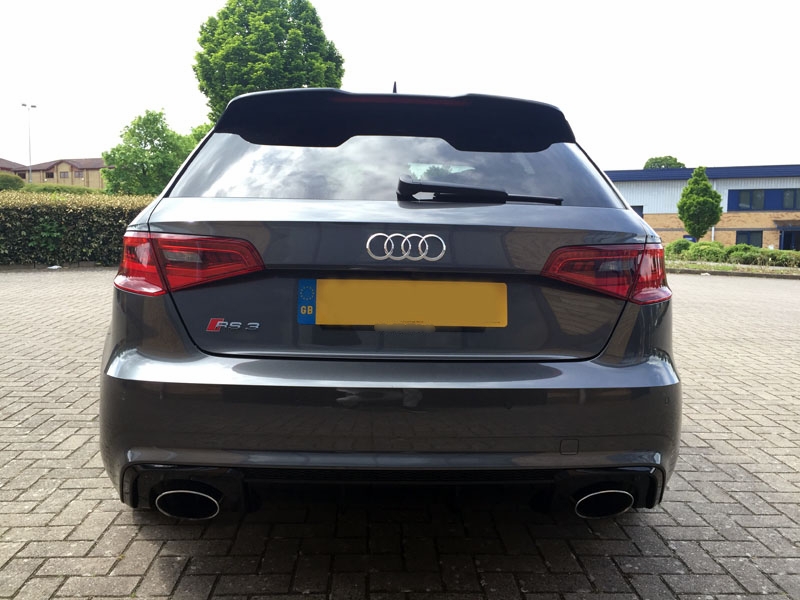
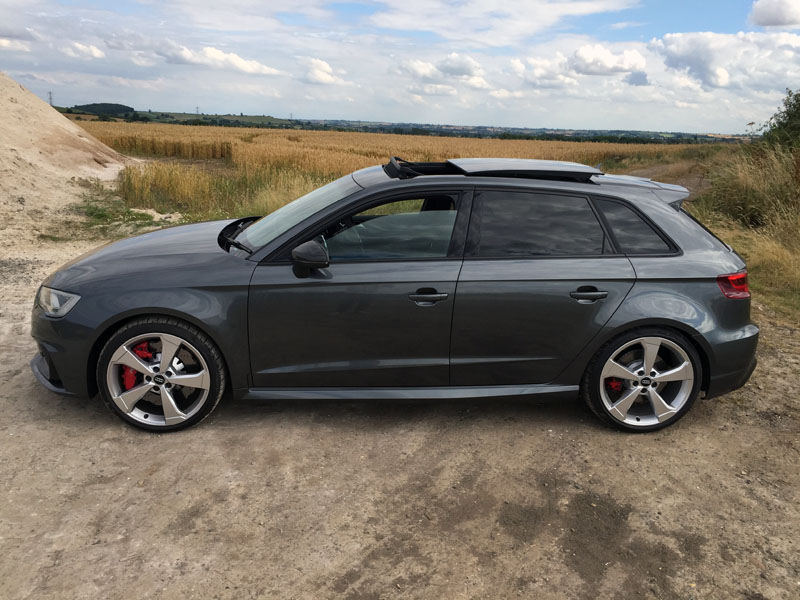
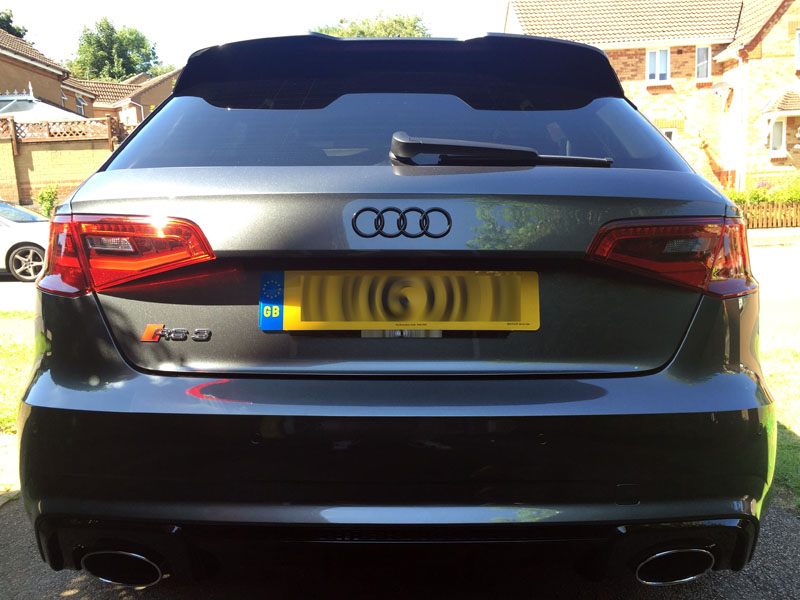
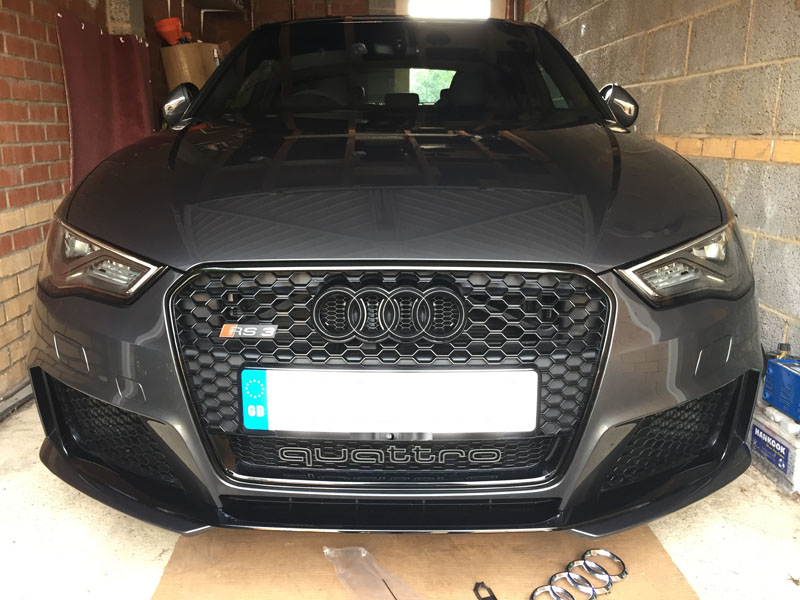
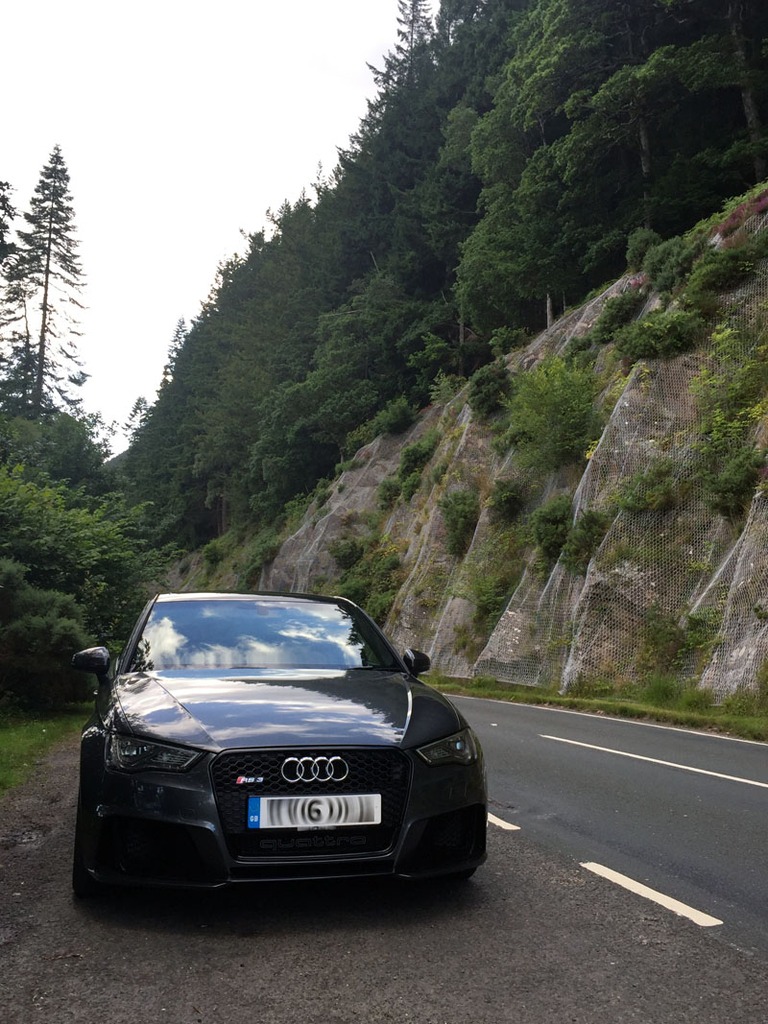
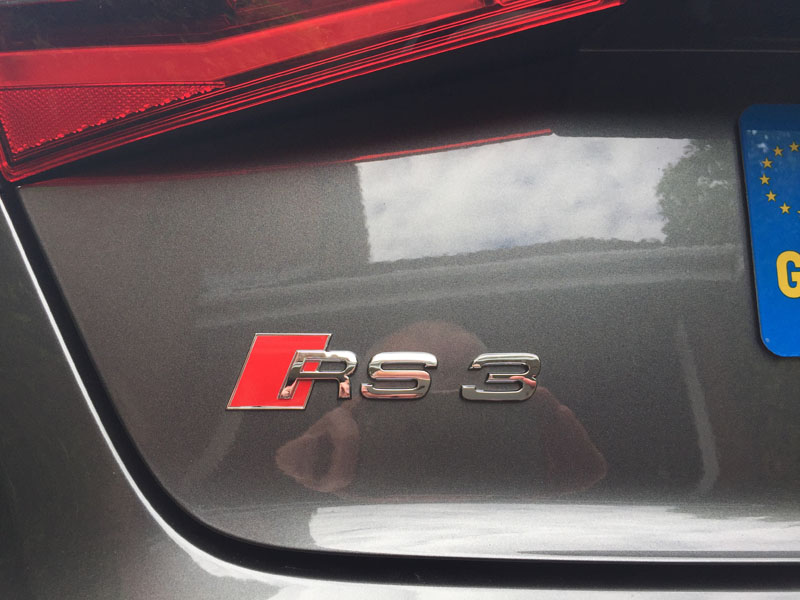
Whilst we all know what an 8V RS3 looks like, here are a few pictures of mine as I picked it up from Audi.
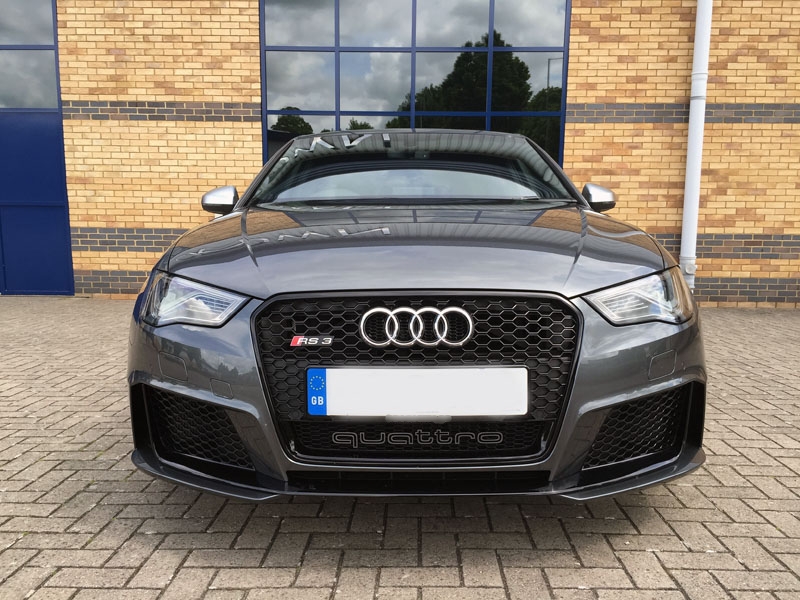
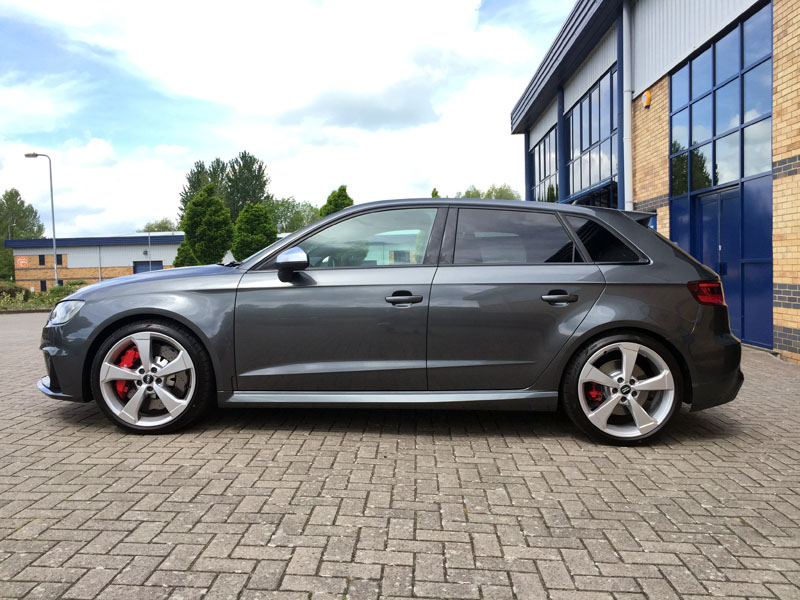
Obviously beauty is in the eye of the beholder, and the RS3 styling takes a bit of a battering from some. In my eyes (well� I do wear glasses!) the RS3 (as with the rest of the RS range, R8 to one side) is pretty much a Q car. Understated, but does what it needs to from a performance perspective.
Based on the previous performance cars I�ve owned the RS3 is quite understated�. but I like that. It�s a change for me and quite a pleasant one. However, I thought I would add a few minor changes�.. perhaps not to everyone�s taste but they are what they are.
Wing Mirrors
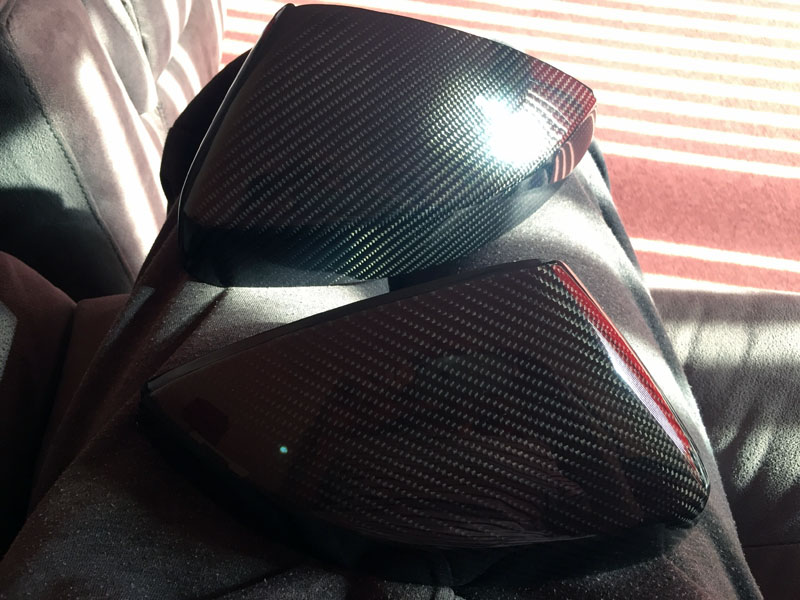
As you can see from the pictures above, my car originally came with the standard matt silver wing mirror covers. I wanted to change these to either black or carbon. Yes, I appreciate there were other options for different colours from Audi, but this car was dealer stock, so I made do with what I had.
I managed to get some carbon ones off eBay for �100, which was cheap, but they used OEM covers and had carbon fibre layered on. I thought for �100 it was worth a punt. After a speedy delivery they turned up. The quality was very good�. I was impressed.
I had heard conflicting stories as to how you could remove the outer covers, with and without taking the whole assembly apart. After a thought process upon receiving the new ones, and seeing where all the lugs were located, I decided to have a go at removing the OEM covers WITHOUT taking the assembly apart.
The way to do this is by inserting a credit card (or equivalent) where you see in the picture below.
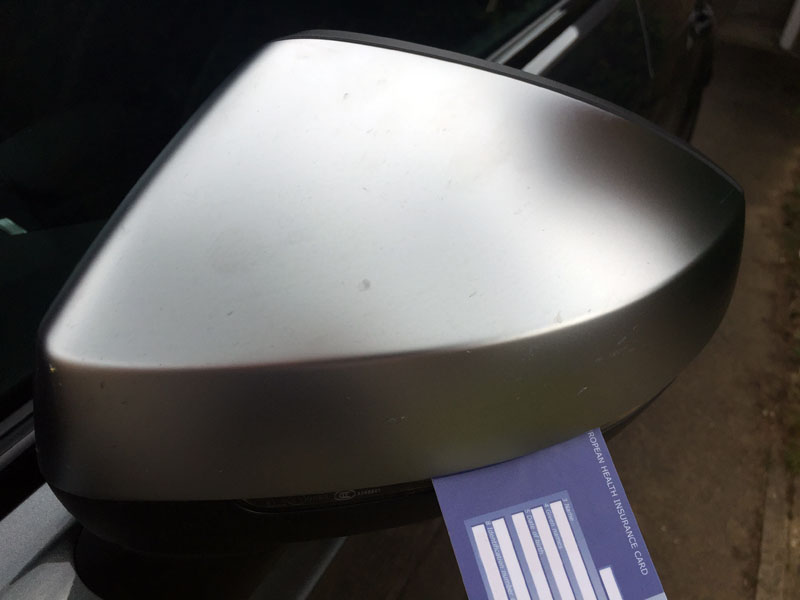
Once you�ve pushed the card in far enough, you�ll see that the clip in that area will release.
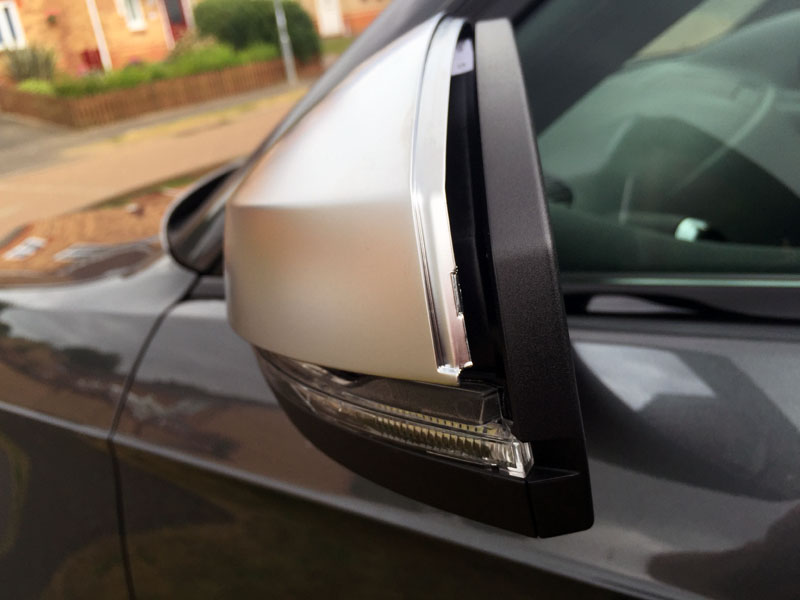
If you then move the card to the right of the picture, you will start to release further clips. You then need to move the card all the way to the left. Once done, you should notice the right hand side starting to come away from the mirror assembly. You can then move the card up that vertical side to further release the cover. Finally give the assembly on the right hand side a slight pull and it should really start to open up.
Now comes the bit where you need to be careful, but slightly forceful at the same time.
Whatever you do, do not pull the cover up. There is a horizontal clip at the left hand side (closest to the car), which will break off if you try to pull the cover up and off. You need to pull the cover into you from the front, gently but with a short / sharp action. It will just come off if you do this and all the clips will be retained.
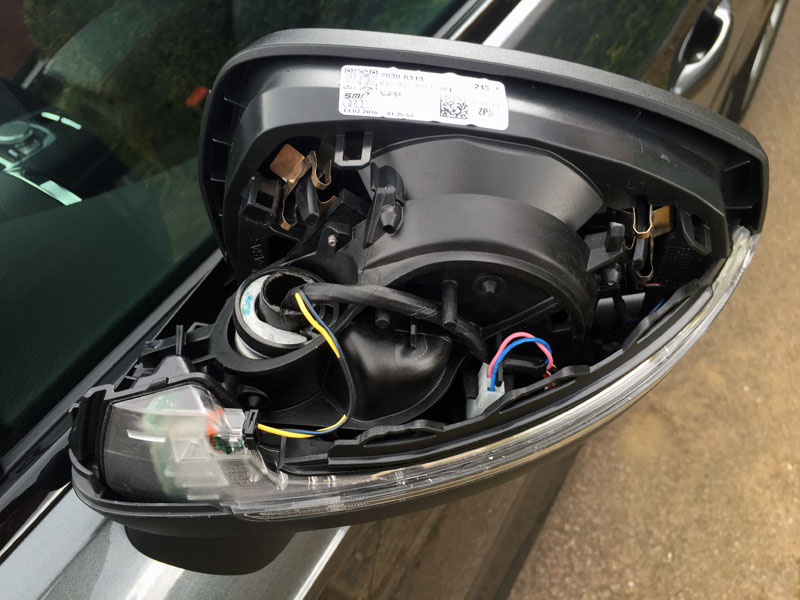
Once the cover is off you�ll be left with the assembly behind the cover�� and no broken clips (if you do it correctly).
The first mirror took me about 10 minutes as I was doing everything carefully to find my way around each clip. The second mirror took me about 2 minutes. I didn�t break a clip on either OEM cover.
The next bit is really easy�.. you just push the new cover on, exactly how you removed the OEM cover. It clips straight back into place.
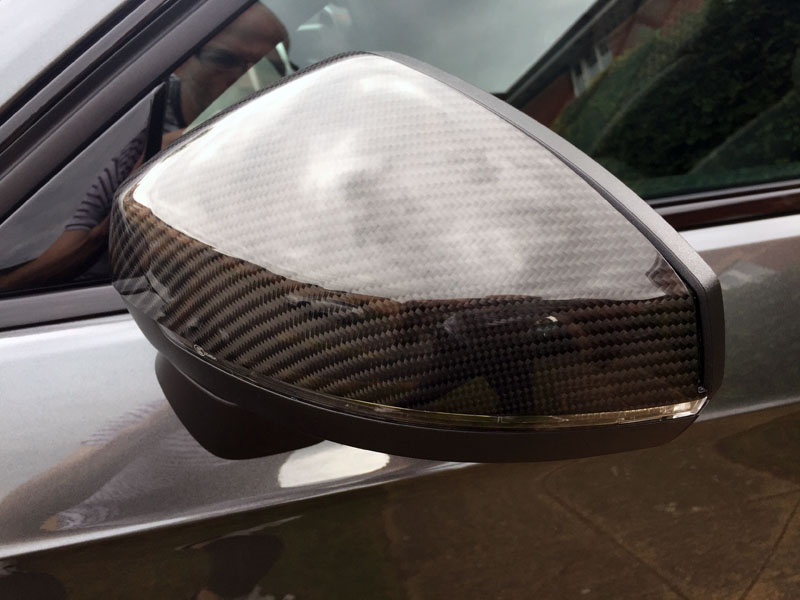
As I said, quality is top notch and for a �100 they were very good value.
They have the desired effect, especially with the car being Daytona�.. Looks quite stealth with black trim.
Audi Rings
You might start to see a pattern as to where I�ll be going with this car�. external styling wise.
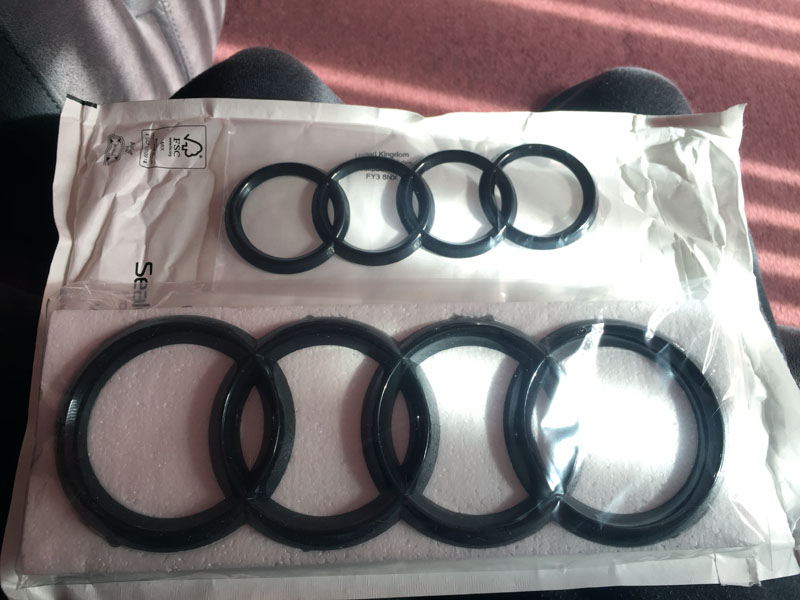
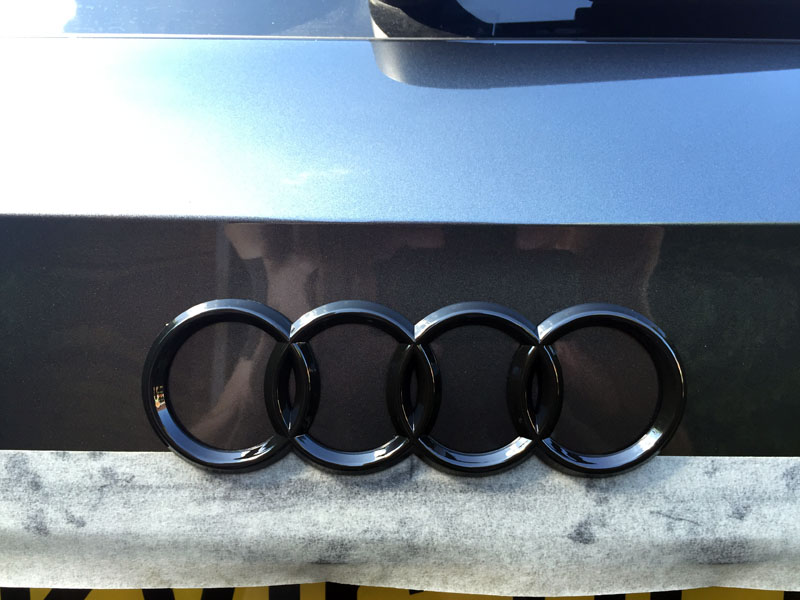
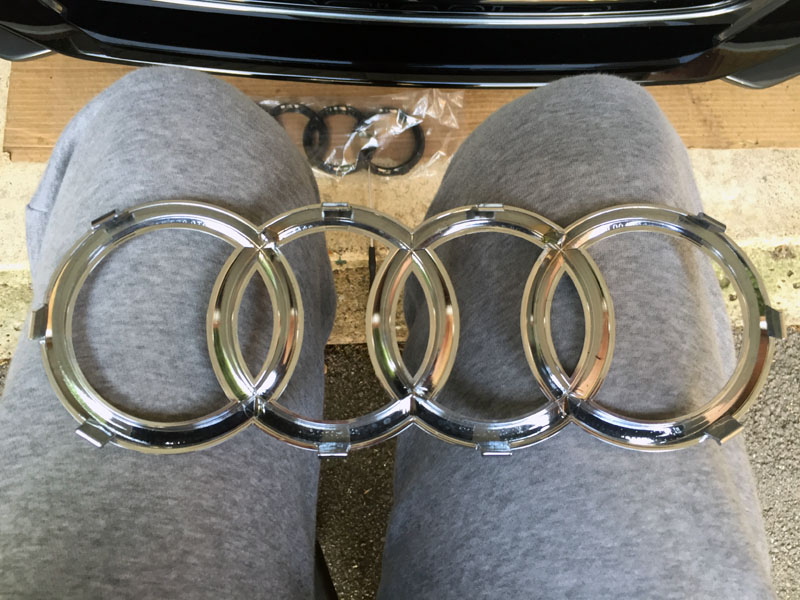
Next up was to replace the front and rear Audi rings with a black ring set. Now, I could have tried the plasti-kote method, but I decided to opt for replacement badge sets.
Again, eBay can be your friend here. I bought this set for just under �20 for the front and rear. You need to be careful ordering the correct front badge, as I understand the 8V badges are slightly bigger than the previous cars. You may also (if you�re eagle eyed) notice the smaller rear rings are slightly smaller than the OEM ones. This isn�t an issue, but there is a difference�. just so you�re aware.
Rear Rings
I started off with replacing the rear ring set.
These are bonded on to the boot lid with adhesive, so using a hairdryer (the Mrs� not mine as I haven't any hair!) I heated the rear badge, and then slid a credit card (same trick as with the mirror covers) between the badge and the boot lid skin to break the seal.
Making sure you keep applying heat, keep repeating this process around the whole badge. I wouldn�t recommend you start to pull the badge off straight away�. you�ll probably end up snapping it. Just take your time.
Once you�ve removed the badge you will still be left with residue from the glue.
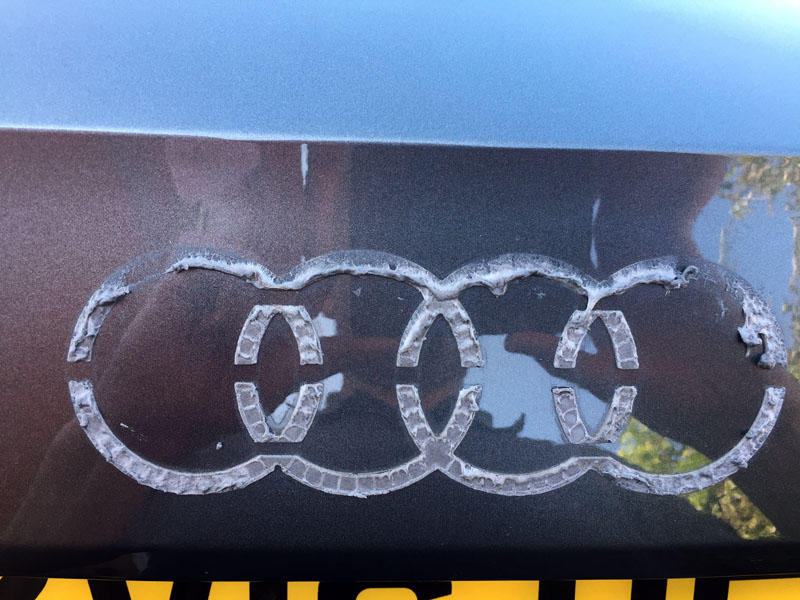
At this point I continued to apply heat and pulled off further what I could.
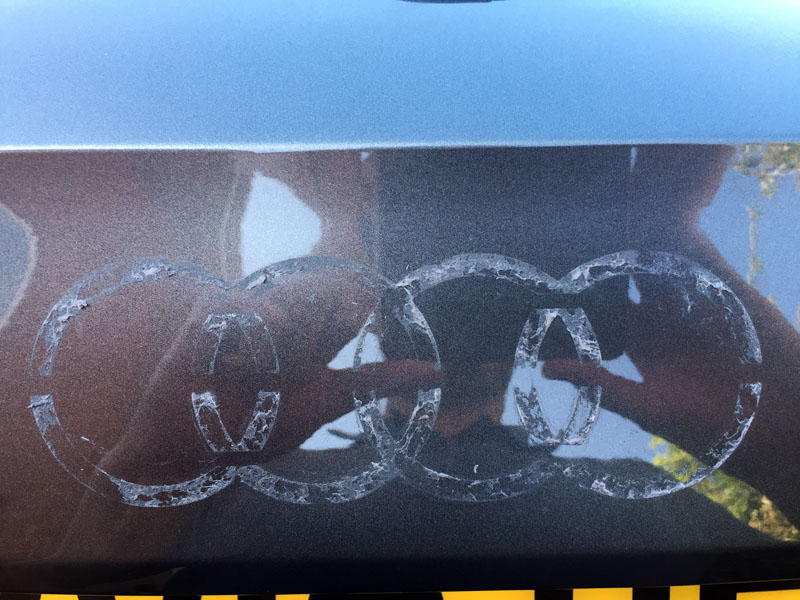
With the last bits of glue left I then turned to using some glue / tar remover (TARDIS). I�ve used this for many years to remove tar from the sides of cars and glue from vinyl car stickers. This emulsifies with water, so is really easy to rinse off. You don�t want any wax or cutting agents left on the panel prior to putting your new badge on.
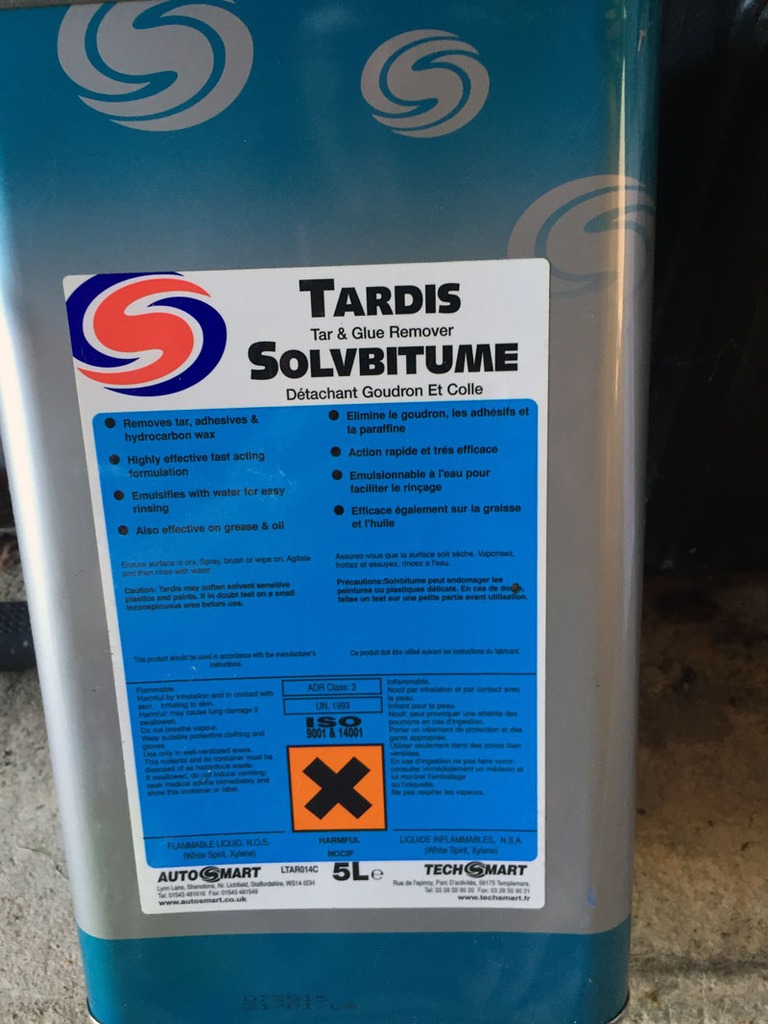
After liberally applying TARDIS and cleaning / rinsing the panel, it was all clear / clean and ready for the new badge.
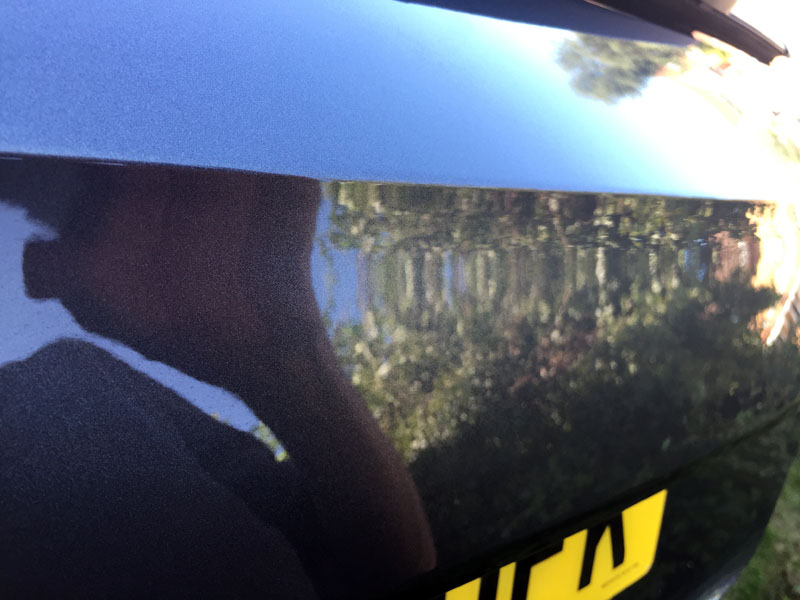
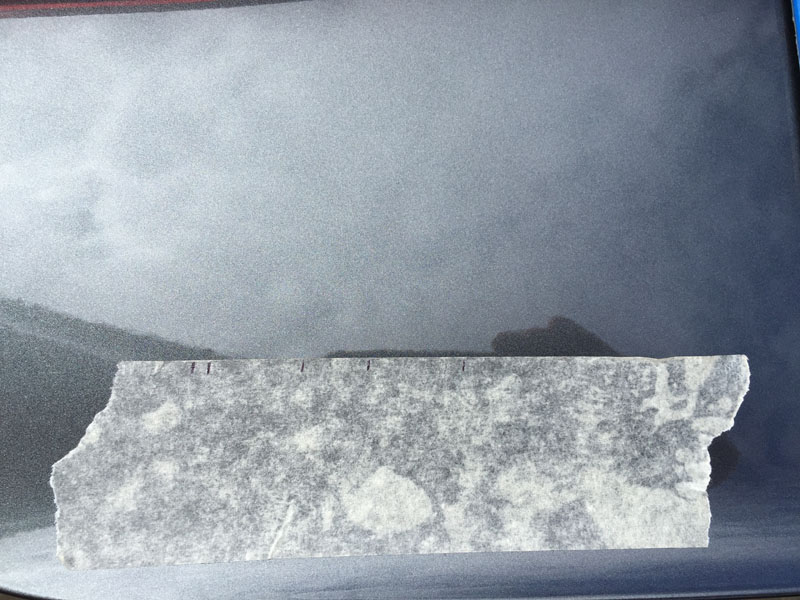
To ensure I put the new badge on square I measured and placed a masking tape line (with a centre position) on the boot lid and offered up the new badge before final fitment.
After I was happy with the positioning I then stuck the new badge on, peeling off the backing to the new adhesive layer on the new badge. Personally I always gently heat the adhesive�. not too much, but just enough to help the bonding process.
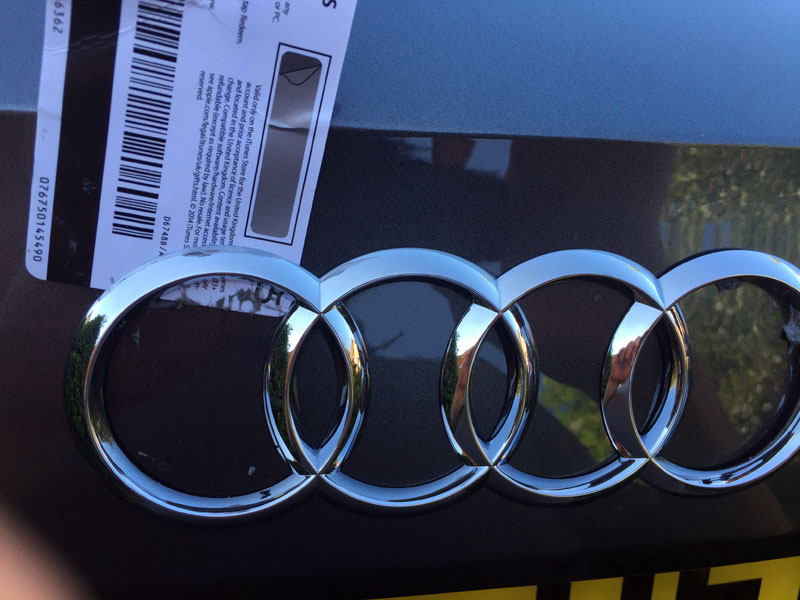
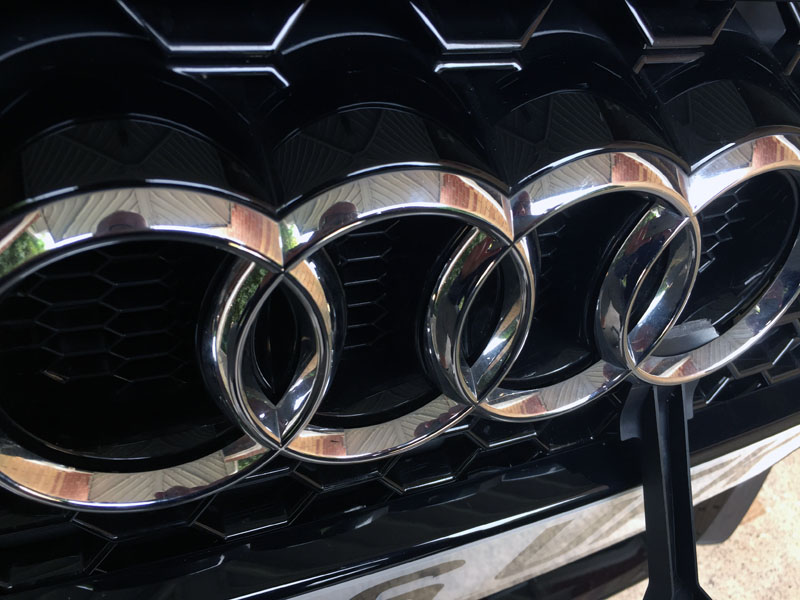
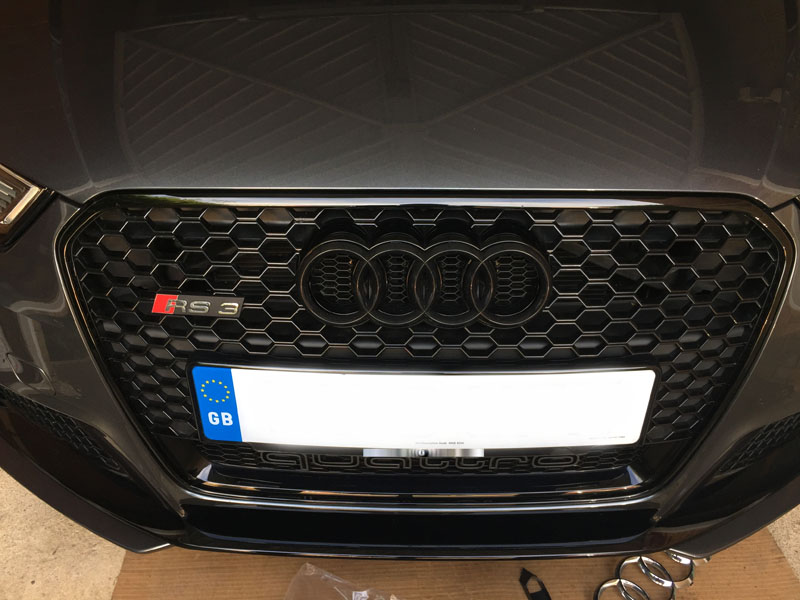
Front Rings
Next up was the front ring set. Again I had heard conflicting stories about removing these. Some saying you needed to remove the front bumper, others saying you can reach down from the top and get to the clips and one other I saw said you could remove from the front. I chose the latter!
In my opinion I would not advise you try to remove the rings from the front (without taking the bumper off) unless you have suitable trim tools, spudgers etc. You�ll either risk snapping the oem badge or damaging the badge grill surrounds.
Using a trim tool start from the bottom. With your new badge as a guide, you�ll see exactly where the securing tabs are and this is where you need to feed the trim tool in to push the tabs back.
As you pop the bottom clips you�ll see the badge coming away from the grill.
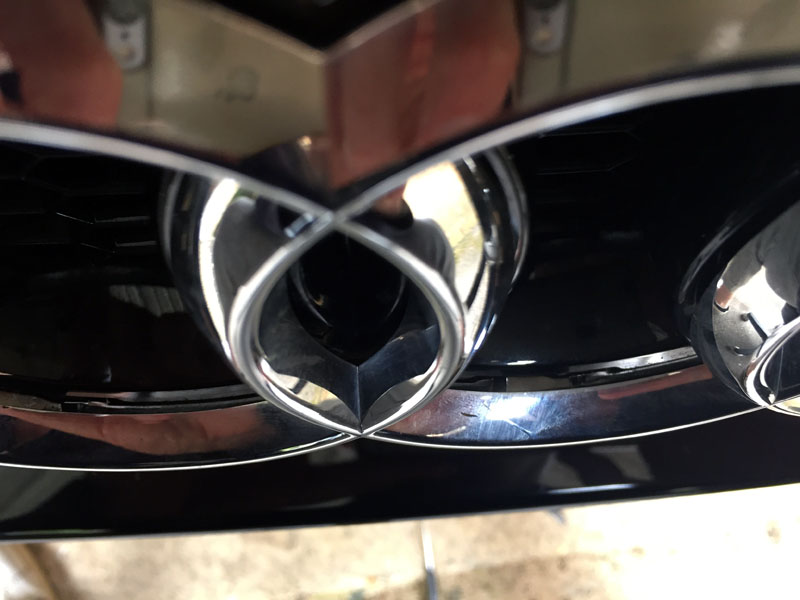
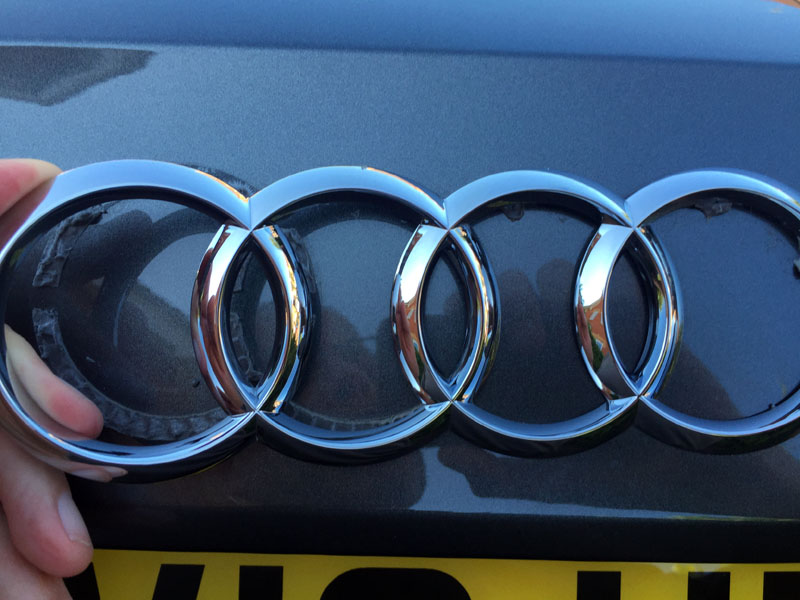
Once you�ve released the bottom and lower side / centre side clips, then move to the top clips.
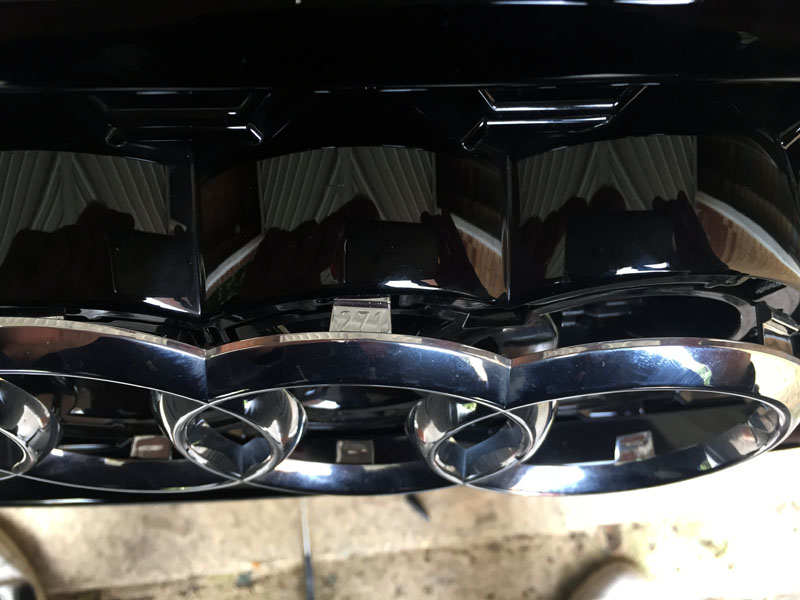
This is the first time I�ve done this and it only took me around 10 minutes. Just to prove I never broke any clips, here is the underside of the OEM badge. There was zero damage to the badge / grill surround either.
Once removed you�ll be faced with the grill ring mount, which will need a minor clean up prior to fitting the new ring set.
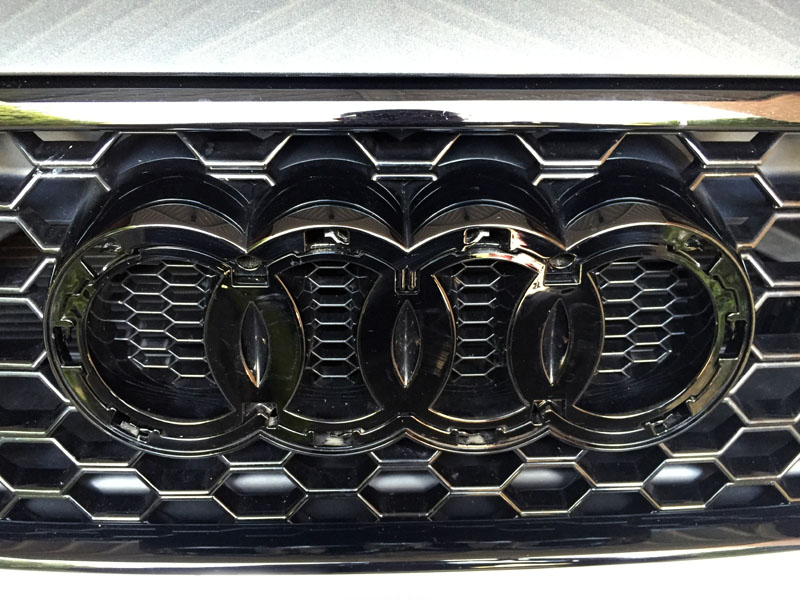
Mounting the new ring set is easy. Just push it on ensuring all the clips are engaged correctly.
Much like the mirrors, I really like the look of the all black trim set. Makes it look stealth, but also aggressive�. not everyone�s cup of tea I�m sure.
So for the time being that�s the first round of styling mods. I�m planning to do a few more things, but I�ll discuss this as and when I get to do them.
So before we delve into the performance side of things I thought I would make a start with completing a few subtle styling mods.
Whilst we all know what an 8V RS3 looks like, here are a few pictures of mine as I picked it up from Audi.


Obviously beauty is in the eye of the beholder, and the RS3 styling takes a bit of a battering from some. In my eyes (well� I do wear glasses!) the RS3 (as with the rest of the RS range, R8 to one side) is pretty much a Q car. Understated, but does what it needs to from a performance perspective.
Based on the previous performance cars I�ve owned the RS3 is quite understated�. but I like that. It�s a change for me and quite a pleasant one. However, I thought I would add a few minor changes�.. perhaps not to everyone�s taste but they are what they are.
Wing Mirrors
As you can see from the pictures above, my car originally came with the standard matt silver wing mirror covers. I wanted to change these to either black or carbon. Yes, I appreciate there were other options for different colours from Audi, but this car was dealer stock, so I made do with what I had.
I managed to get some carbon ones off eBay for �100, which was cheap, but they used OEM covers and had carbon fibre layered on. I thought for �100 it was worth a punt. After a speedy delivery they turned up. The quality was very good�. I was impressed.

I had heard conflicting stories as to how you could remove the outer covers, with and without taking the whole assembly apart. After a thought process upon receiving the new ones, and seeing where all the lugs were located, I decided to have a go at removing the OEM covers WITHOUT taking the assembly apart.
The way to do this is by inserting a credit card (or equivalent) where you see in the picture below.

Once you�ve pushed the card in far enough, you�ll see that the clip in that area will release.
If you then move the card to the right of the picture, you will start to release further clips. You then need to move the card all the way to the left. Once done, you should notice the right hand side starting to come away from the mirror assembly. You can then move the card up that vertical side to further release the cover. Finally give the assembly on the right hand side a slight pull and it should really start to open up.

Now comes the bit where you need to be careful, but slightly forceful at the same time.
Whatever you do, do not pull the cover up. There is a horizontal clip at the left hand side (closest to the car), which will break off if you try to pull the cover up and off. You need to pull the cover into you from the front, gently but with a short / sharp action. It will just come off if you do this and all the clips will be retained.
Once the cover is off you�ll be left with the assembly behind the cover�� and no broken clips (if you do it correctly).

The first mirror took me about 10 minutes as I was doing everything carefully to find my way around each clip. The second mirror took me about 2 minutes. I didn�t break a clip on either OEM cover.
The next bit is really easy�.. you just push the new cover on, exactly how you removed the OEM cover. It clips straight back into place.

As I said, quality is top notch and for a �100 they were very good value.
They have the desired effect, especially with the car being Daytona�.. Looks quite stealth with black trim.

Audi Rings
You might start to see a pattern as to where I�ll be going with this car�. external styling wise.
Next up was to replace the front and rear Audi rings with a black ring set. Now, I could have tried the plasti-kote method, but I decided to opt for replacement badge sets.
Again, eBay can be your friend here. I bought this set for just under �20 for the front and rear. You need to be careful ordering the correct front badge, as I understand the 8V badges are slightly bigger than the previous cars. You may also (if you�re eagle eyed) notice the smaller rear rings are slightly smaller than the OEM ones. This isn�t an issue, but there is a difference�. just so you�re aware.

Rear Rings
I started off with replacing the rear ring set.
These are bonded on to the boot lid with adhesive, so using a hairdryer (the Mrs� not mine as I haven't any hair!) I heated the rear badge, and then slid a credit card (same trick as with the mirror covers) between the badge and the boot lid skin to break the seal.


Making sure you keep applying heat, keep repeating this process around the whole badge. I wouldn�t recommend you start to pull the badge off straight away�. you�ll probably end up snapping it. Just take your time.
Once you�ve removed the badge you will still be left with residue from the glue.

At this point I continued to apply heat and pulled off further what I could.

With the last bits of glue left I then turned to using some glue / tar remover (TARDIS). I�ve used this for many years to remove tar from the sides of cars and glue from vinyl car stickers. This emulsifies with water, so is really easy to rinse off. You don�t want any wax or cutting agents left on the panel prior to putting your new badge on.

After liberally applying TARDIS and cleaning / rinsing the panel, it was all clear / clean and ready for the new badge.

To ensure I put the new badge on square I measured and placed a masking tape line (with a centre position) on the boot lid and offered up the new badge before final fitment.

After I was happy with the positioning I then stuck the new badge on, peeling off the backing to the new adhesive layer on the new badge. Personally I always gently heat the adhesive�. not too much, but just enough to help the bonding process.

Front Rings
Next up was the front ring set. Again I had heard conflicting stories about removing these. Some saying you needed to remove the front bumper, others saying you can reach down from the top and get to the clips and one other I saw said you could remove from the front. I chose the latter!
In my opinion I would not advise you try to remove the rings from the front (without taking the bumper off) unless you have suitable trim tools, spudgers etc. You�ll either risk snapping the oem badge or damaging the badge grill surrounds.
Using a trim tool start from the bottom. With your new badge as a guide, you�ll see exactly where the securing tabs are and this is where you need to feed the trim tool in to push the tabs back.

As you pop the bottom clips you�ll see the badge coming away from the grill.

Once you�ve released the bottom and lower side / centre side clips, then move to the top clips.

This is the first time I�ve done this and it only took me around 10 minutes. Just to prove I never broke any clips, here is the underside of the OEM badge. There was zero damage to the badge / grill surround either.

Once removed you�ll be faced with the grill ring mount, which will need a minor clean up prior to fitting the new ring set.

Mounting the new ring set is easy. Just push it on ensuring all the clips are engaged correctly.
Much like the mirrors, I really like the look of the all black trim set. Makes it look stealth, but also aggressive�. not everyone�s cup of tea I�m sure.


So for the time being that�s the first round of styling mods. I�m planning to do a few more things, but I�ll discuss this as and when I get to do them.
14 August 2016, 10:08 PM
#4
Scooby Regular
Thread Starter
Stock Power Performance Benchmarking
Whilst this piece of benchmark data will be quite specific, it will give a baseline for where the car is at the moment in its stock state. As I progress I will be gaining more data, not just from the drag strip, but also from getting VBOX logs for acceleration and in-gear performance. I have a lot of data from my previous A45 (which will be a good comparison), together with other RS3 data I have from a REVO tuned Stage 1 and MRC Stage 3 car. I’ll be overlaying and all sorts, so this will be interesting moving forward. Of course I’ll also gather dyno information as I progress… again, I can overlay this data against my A45 for comparison.
Shakespeare County Raceway
So three weeks back, after running the car in (just over 1k on the clock), I ventured down to Shakespeare to see what my stock car would do. Obviously the engine would still be fairly tight, but I needed to get some baseline data in.
As they say….. The bull**** stops when the flag drops. You’ll hear me repeat that quite a few times throughout this project thread!
I haven’t had the car on the weighbridge yet (will do though) but it is pretty highly spec’d, at least in regards to the “added weight” options! Lol Good for the gadgets…. Not so great for acceleration.
I personally prefer Shakespeare as it’s normally quieter than the Pod…. this day was no exception.
It was a warm day, circa 24degs and little to no wind. The downside was that the track had not been used in a few weeks and it had been raining the day before. Surface prep is key at these places.
I don't really like running early on, especially when no events were the previous day. You tend to find the start line will be a tad "waxy" until some rubber goes down and the track heat starts to build up a bit.
I understand that the RS3 suffers with intercooler issues in warm weather (the A45 charge cooler was unbelievably efficient and effective), so to some degree I wasn’t expecting the car to perform it’s best.
After signing on you need to get your car scrutineered. Not something you need to do at Santa Pod. The rules are the rules though! Lol Thankfully being a new car, it didn’t take long. The scrutineers laughed when they found out how many miles were on it.
Once scrutineered you’re given a running number, which is painted (don’t worry it comes off) on your back screen. Well, they gotta know which car to log the times against.
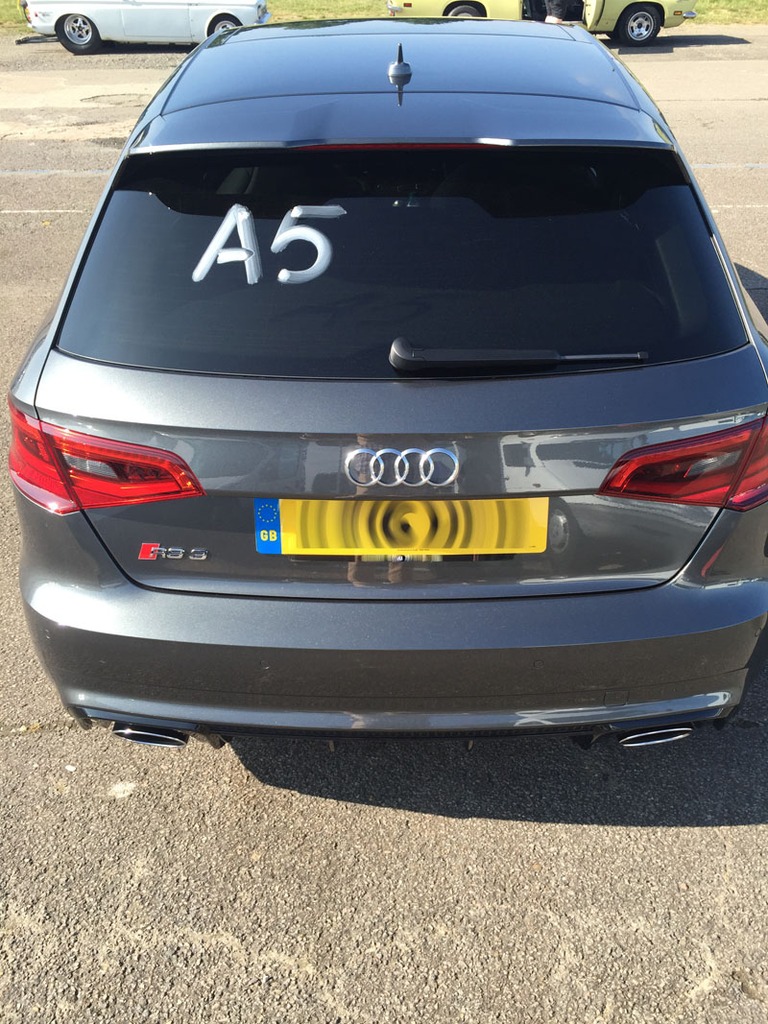
It was a shame I didn’t arrive a couple of minutes earlier…. I could have bagged “A3” as my number!!!!
So with the car ready, I went down to the “fire up lane” in readiness for my virgin run in the RS3.
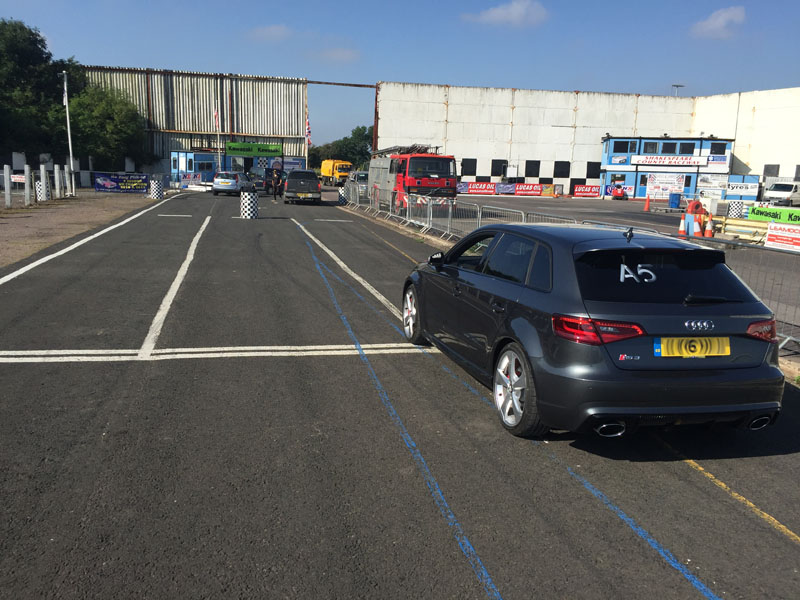
Yes… I was first in line.
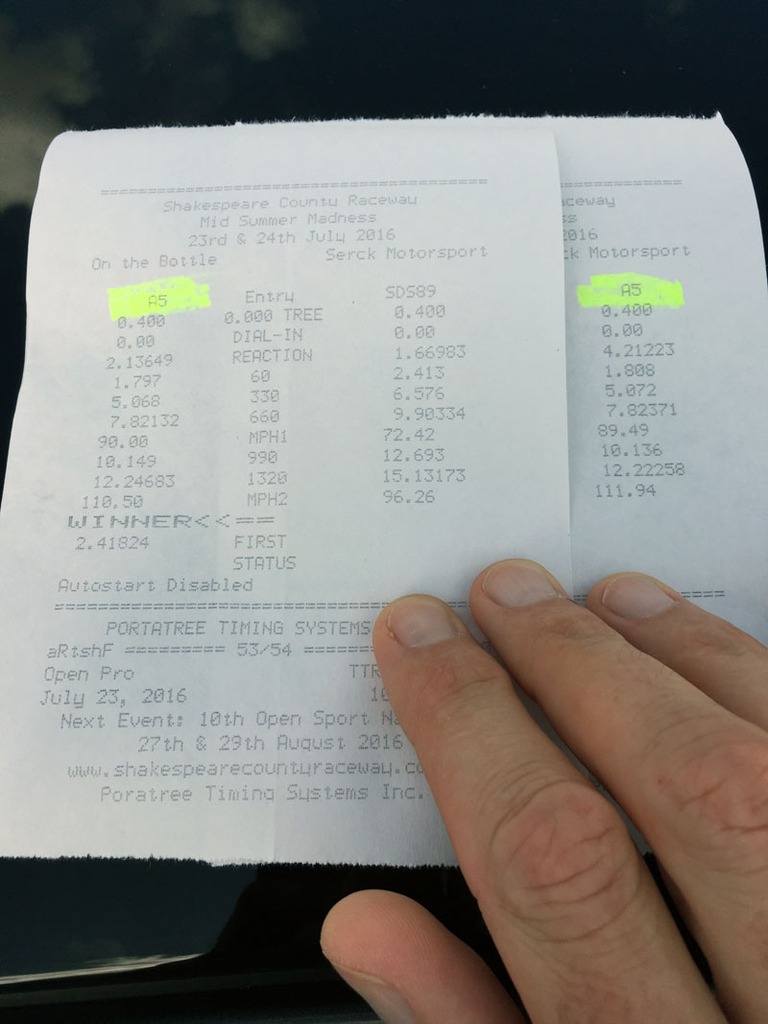
First run 12.22 @ 111.94mph
Believe it or not this was the first time I had actually launched the RS3. I was a bit nervous I was going to ***** it up, but unlike the A45 LC, the RS3 is so much easier to set-up. And unlike my A45, the RS3 just gripped and went like a stabbed rate off the line. Christ the LC on the RS3 is smooth…. Like so smooth. The gearbox as well is a country mile better than the Mercs on the strip. The whole run just went ahead with no drama….. It felt good, which the time and terminal speed showed. This is pretty damn quick for a stock hatchback.
Second run 12.24 @ 110.50mph
Felt just as good as the first run….. How’s the time for consistency. Lol Not sure why the trap speed had decreased… could have been heat soak perhaps.
Now normally I’d be getting really **** and checking / playing with tyre pressures (lowering pressures can aid launch grip), but since this car just launched with no wheel spin or axle tramp, I really didn’t see the need to faff around with anything. The 60ft times back that up with a good 1.79s and 1.80s respectively.
Quite abnormal for me I decided at this point to hand in the gloves. I was happy with those times with a stock car, and as they were so close on both runs, I didn’t think there was much point in further runs. In reality I should have parked the car up and ran later on in the day, once more rubber had been put down…. It may have helped.
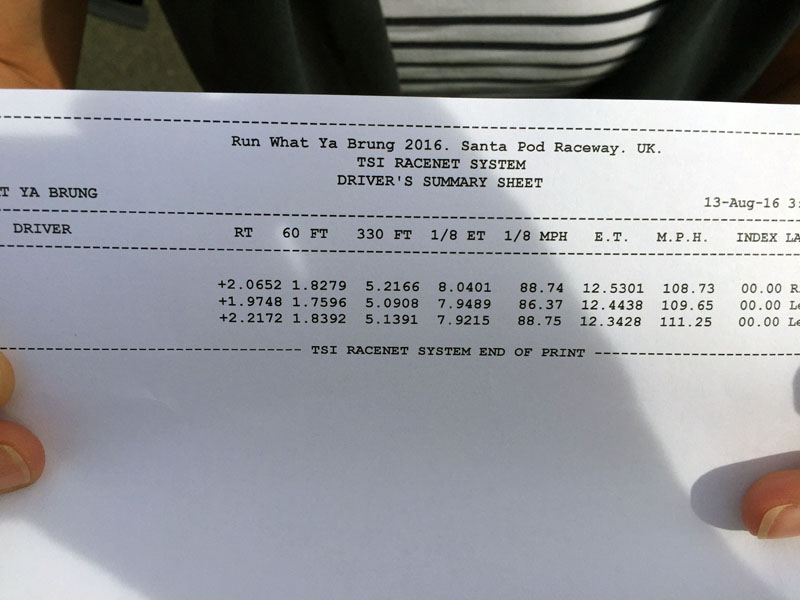
Santa Pod
This weekend I decided to take the car down the strip again….. Just for a bit of fun of course! This time though I was going to use the UK’s de facto drag strip. Santa Pod.
The reason for going in reality was I wanted to see if I could better the previous 12.2 and also try a different launch technique to see if I could bring the 60ft time down. Improving the 60ft time can have a dramatic affect on the ET’s.
Luckily the day was dry, sunny but was once again warm. Certainly felt warmer than the 25deg ambient suggested. The event was pretty busy as well. Not great and something I don’t really like about the Pod…. it tends to get very busy, which means you spend a lot of time queuing for your next run. Not ideal by any stretch.
I actually didn’t arrive until lunch time, but I had already heard via whatsapp that the track appeared to be running slower than normal (based on the times that other guys were getting - not in RS3’s mind). There was also a cross wind…. again pretty normal for the Pod.
First run 12.53 @ 108.73
For the first run I launched as I had previously as Shakespeare, using Sports mode on the ESC. It felt good and smooth….. Until I saw my timing slip. Christ that wasn’t good at all. Lol 60ft wasn’t brilliant at 1.82s, but certainly nothing that made me think that was the reason for the slower ET.
Second run 12.44 @ 109.65
Due to the amount of cars running and I did rejoin the queue straight away, I had to wait nearly an hour for the next run. I forgot to take my OBD logger with me, but my charge inlet temps must have been sky high.
This time I tried launching with the ESC OFF.
As soon as the car launched it lit the front tyres up and I had slight axle tramp. Because of this I thought the run was not as good, but it certainly bettered the previous run. The 60ft time had dropped to a good 1.75s, which was where I really wanted to be.
Third run 12.34 @ 111.25
Again, well over another hour had passed before getting my third run in.
For this run I went back to the ESC in Sports Mode, just to see what would happen to the 60ft. It went back up to 1.83, but the overall run was quicker and with a better trap speed. Not sure if the track was starting to improve or what.
Anyway… it was now just before 4pm and I didn’t think there was much more reason to carry on, so I called it a day.
Of course I was hoping I could achieve a better time overall at either event, but all things considered it’s bloody quick for a stock hatchback. As a comparison my previous A45 was no quicker down the strip when it had a Tuning Box fitted (running 12.2s). Stock, the A45 runs around a 12.7s quarter.
At the end of the day this provides a baseline…… future times will be a good comparison.
I hope to be back down the strip in September once I’ve added the first round of mods.
Whilst this piece of benchmark data will be quite specific, it will give a baseline for where the car is at the moment in its stock state. As I progress I will be gaining more data, not just from the drag strip, but also from getting VBOX logs for acceleration and in-gear performance. I have a lot of data from my previous A45 (which will be a good comparison), together with other RS3 data I have from a REVO tuned Stage 1 and MRC Stage 3 car. I’ll be overlaying and all sorts, so this will be interesting moving forward. Of course I’ll also gather dyno information as I progress… again, I can overlay this data against my A45 for comparison.
Shakespeare County Raceway
So three weeks back, after running the car in (just over 1k on the clock), I ventured down to Shakespeare to see what my stock car would do. Obviously the engine would still be fairly tight, but I needed to get some baseline data in.
As they say….. The bull**** stops when the flag drops. You’ll hear me repeat that quite a few times throughout this project thread!
I haven’t had the car on the weighbridge yet (will do though) but it is pretty highly spec’d, at least in regards to the “added weight” options! Lol Good for the gadgets…. Not so great for acceleration.
I personally prefer Shakespeare as it’s normally quieter than the Pod…. this day was no exception.
It was a warm day, circa 24degs and little to no wind. The downside was that the track had not been used in a few weeks and it had been raining the day before. Surface prep is key at these places.
I don't really like running early on, especially when no events were the previous day. You tend to find the start line will be a tad "waxy" until some rubber goes down and the track heat starts to build up a bit.
I understand that the RS3 suffers with intercooler issues in warm weather (the A45 charge cooler was unbelievably efficient and effective), so to some degree I wasn’t expecting the car to perform it’s best.
After signing on you need to get your car scrutineered. Not something you need to do at Santa Pod. The rules are the rules though! Lol Thankfully being a new car, it didn’t take long. The scrutineers laughed when they found out how many miles were on it.
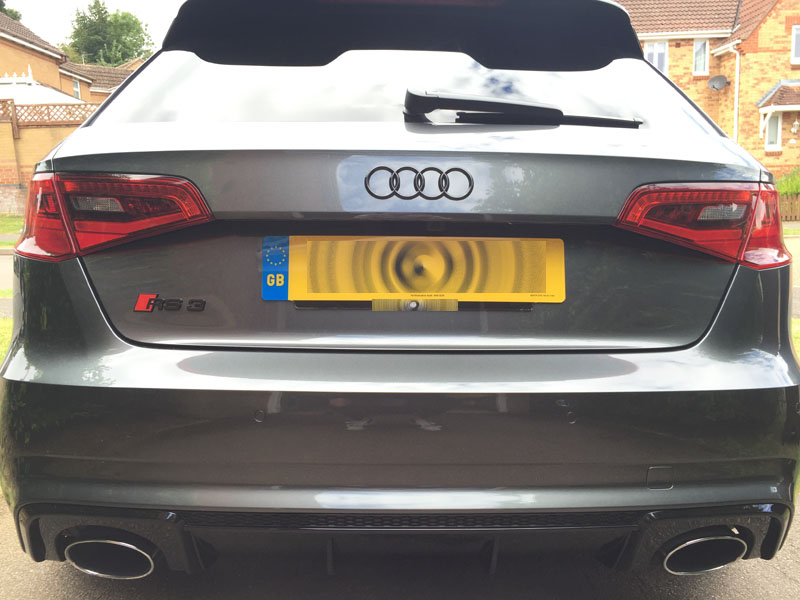
Once scrutineered you’re given a running number, which is painted (don’t worry it comes off) on your back screen. Well, they gotta know which car to log the times against.

It was a shame I didn’t arrive a couple of minutes earlier…. I could have bagged “A3” as my number!!!!
So with the car ready, I went down to the “fire up lane” in readiness for my virgin run in the RS3.

Yes… I was first in line.
First run 12.22 @ 111.94mph
Believe it or not this was the first time I had actually launched the RS3. I was a bit nervous I was going to ***** it up, but unlike the A45 LC, the RS3 is so much easier to set-up. And unlike my A45, the RS3 just gripped and went like a stabbed rate off the line. Christ the LC on the RS3 is smooth…. Like so smooth. The gearbox as well is a country mile better than the Mercs on the strip. The whole run just went ahead with no drama….. It felt good, which the time and terminal speed showed. This is pretty damn quick for a stock hatchback.
Second run 12.24 @ 110.50mph
Felt just as good as the first run….. How’s the time for consistency. Lol Not sure why the trap speed had decreased… could have been heat soak perhaps.
Now normally I’d be getting really **** and checking / playing with tyre pressures (lowering pressures can aid launch grip), but since this car just launched with no wheel spin or axle tramp, I really didn’t see the need to faff around with anything. The 60ft times back that up with a good 1.79s and 1.80s respectively.
Quite abnormal for me I decided at this point to hand in the gloves. I was happy with those times with a stock car, and as they were so close on both runs, I didn’t think there was much point in further runs. In reality I should have parked the car up and ran later on in the day, once more rubber had been put down…. It may have helped.

Santa Pod
This weekend I decided to take the car down the strip again….. Just for a bit of fun of course! This time though I was going to use the UK’s de facto drag strip. Santa Pod.
The reason for going in reality was I wanted to see if I could better the previous 12.2 and also try a different launch technique to see if I could bring the 60ft time down. Improving the 60ft time can have a dramatic affect on the ET’s.
Luckily the day was dry, sunny but was once again warm. Certainly felt warmer than the 25deg ambient suggested. The event was pretty busy as well. Not great and something I don’t really like about the Pod…. it tends to get very busy, which means you spend a lot of time queuing for your next run. Not ideal by any stretch.
I actually didn’t arrive until lunch time, but I had already heard via whatsapp that the track appeared to be running slower than normal (based on the times that other guys were getting - not in RS3’s mind). There was also a cross wind…. again pretty normal for the Pod.
First run 12.53 @ 108.73
For the first run I launched as I had previously as Shakespeare, using Sports mode on the ESC. It felt good and smooth….. Until I saw my timing slip. Christ that wasn’t good at all. Lol 60ft wasn’t brilliant at 1.82s, but certainly nothing that made me think that was the reason for the slower ET.
Second run 12.44 @ 109.65
Due to the amount of cars running and I did rejoin the queue straight away, I had to wait nearly an hour for the next run. I forgot to take my OBD logger with me, but my charge inlet temps must have been sky high.
This time I tried launching with the ESC OFF.
As soon as the car launched it lit the front tyres up and I had slight axle tramp. Because of this I thought the run was not as good, but it certainly bettered the previous run. The 60ft time had dropped to a good 1.75s, which was where I really wanted to be.
Third run 12.34 @ 111.25
Again, well over another hour had passed before getting my third run in.
For this run I went back to the ESC in Sports Mode, just to see what would happen to the 60ft. It went back up to 1.83, but the overall run was quicker and with a better trap speed. Not sure if the track was starting to improve or what.
Anyway… it was now just before 4pm and I didn’t think there was much more reason to carry on, so I called it a day.

Of course I was hoping I could achieve a better time overall at either event, but all things considered it’s bloody quick for a stock hatchback. As a comparison my previous A45 was no quicker down the strip when it had a Tuning Box fitted (running 12.2s). Stock, the A45 runs around a 12.7s quarter.
At the end of the day this provides a baseline…… future times will be a good comparison.
I hope to be back down the strip in September once I’ve added the first round of mods.
15 August 2016, 08:06 PM
#6
Scooby Regular
Thread Starter
Feedback on some of the common �issues�
I thought I would also add some feedback on my experiences over the past 3k miles of use in respect of, shall we say, some of the more common problems reported with the RS3.
To add some context this is a second car for me. More of a weekend blaster in reality. However, saying this I have managed to cover just over 3k miles in 12 weeks. This has predominantly been down to the running in, wanting to get that out of the way, and also a Scotland Road Trip I undertook in the RS3 last week.
I�ll digress slightly, but if you have never done a full on road trip around Scotland�. I would highly recommend you do it.
I�ve been threatening to do this for years and now wish I had years ago.
What a fantastic place to drive�. Yes there are still places in the UK for doing that! And the scenery� simply wow!
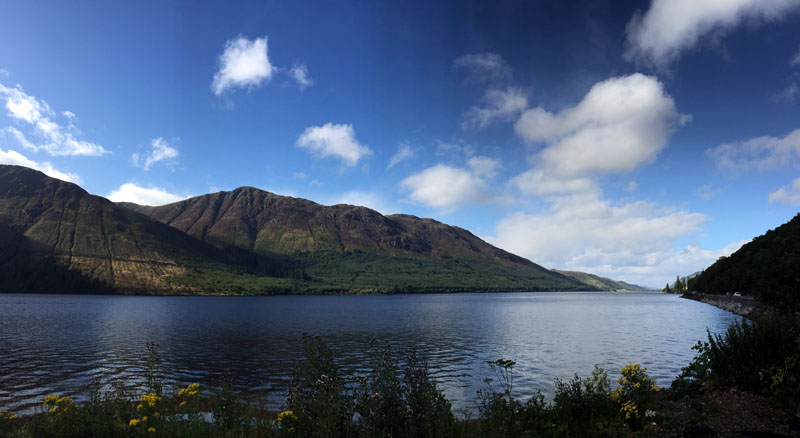
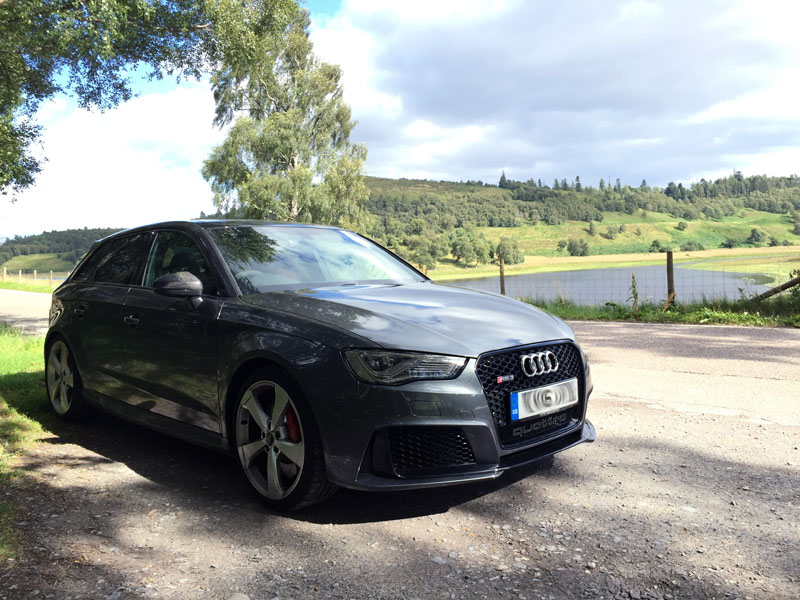
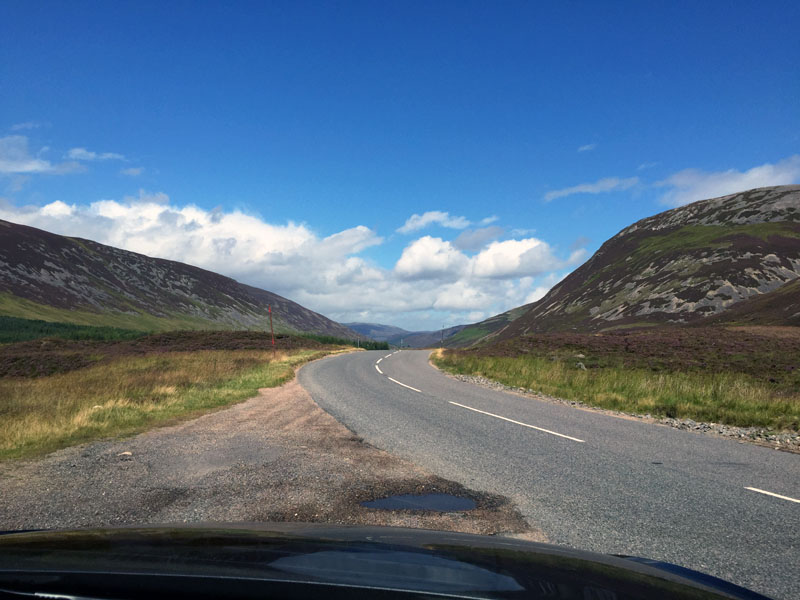
Over 6 days we covered just over 1500 miles in the RS3, and it was faultless from a drivers perspective. Opening the car up over the highlands was great and the car was effortless to drive quickly.
Oil Consumption
I haven�t owned a VAG car for some years now, and when I did they weren�t renowned for chomping oil. Whilst I�m not suggesting they are chompers now, they do appear to have a leaning towards an engine that tends to consume oil. Due to this I have regularly monitored the oil level.
Prior to going on the trip to Scotland the dipstick was at MAX, so that was after 1500 miles.
As soon as arrived back at home (just over 3k miles in total), I parked the car up in the garage and left it for 10 mins and then checked the dipstick.
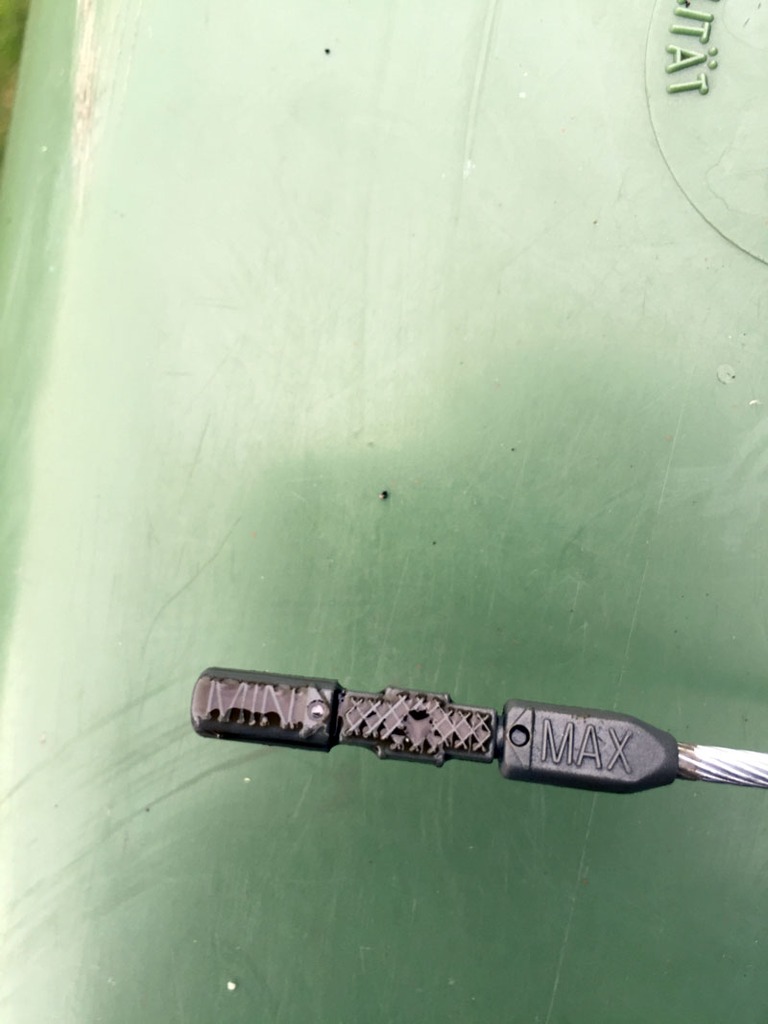
As you can see it is virtually MAX.
The next morning I checked it again (cold) and it was at the same level one side and two diamonds down from MAX on the other side.
After I went down Santa Pod at the weekend I checked it again when home (warm). It had returned to MAX on both sides.
If it�s used any oil over the past 3k miles it is certainly minimal.
I�m quite **** about the running in process and whilst I don�t smash the backside out of the engine during that period, I certainly ensure it gets a varied workout, with plenty of mixed loading. Using the box often and engine braking quite a lot. Whether this has helped with my oil usage, who knows, but it�s the approach I have always taken with new engines.
I will obviously still monitor oil usage but based on what I�ve done so far I can�t see consumption being an issue, especially as I�ll normally only do around 5k per year and I�m on fixed 12 month services.
Brake Squeal
Not one bit of squeal or brake performance issue so far. Not saying it won�t happen, but nothing has materialised yet. Discs are clean and pads look 100% with no sign of accelerated wear.
Knocking Rear Top Mounts
Quiet and no noise. My car is a March 16 build date iirc, so not sure if that makes a difference. Again, no issues thus far.
The car had quite a heavy workout over the Highlands, but as of yet, none of the common issues have really reared their heads.
We�ll obviously see how this goes moving forward.
I thought I would also add some feedback on my experiences over the past 3k miles of use in respect of, shall we say, some of the more common problems reported with the RS3.
To add some context this is a second car for me. More of a weekend blaster in reality. However, saying this I have managed to cover just over 3k miles in 12 weeks. This has predominantly been down to the running in, wanting to get that out of the way, and also a Scotland Road Trip I undertook in the RS3 last week.
I�ll digress slightly, but if you have never done a full on road trip around Scotland�. I would highly recommend you do it.
I�ve been threatening to do this for years and now wish I had years ago.
What a fantastic place to drive�. Yes there are still places in the UK for doing that! And the scenery� simply wow!


Over 6 days we covered just over 1500 miles in the RS3, and it was faultless from a drivers perspective. Opening the car up over the highlands was great and the car was effortless to drive quickly.
Oil Consumption
I haven�t owned a VAG car for some years now, and when I did they weren�t renowned for chomping oil. Whilst I�m not suggesting they are chompers now, they do appear to have a leaning towards an engine that tends to consume oil. Due to this I have regularly monitored the oil level.
Prior to going on the trip to Scotland the dipstick was at MAX, so that was after 1500 miles.
As soon as arrived back at home (just over 3k miles in total), I parked the car up in the garage and left it for 10 mins and then checked the dipstick.

As you can see it is virtually MAX.
The next morning I checked it again (cold) and it was at the same level one side and two diamonds down from MAX on the other side.
After I went down Santa Pod at the weekend I checked it again when home (warm). It had returned to MAX on both sides.
If it�s used any oil over the past 3k miles it is certainly minimal.
I�m quite **** about the running in process and whilst I don�t smash the backside out of the engine during that period, I certainly ensure it gets a varied workout, with plenty of mixed loading. Using the box often and engine braking quite a lot. Whether this has helped with my oil usage, who knows, but it�s the approach I have always taken with new engines.
I will obviously still monitor oil usage but based on what I�ve done so far I can�t see consumption being an issue, especially as I�ll normally only do around 5k per year and I�m on fixed 12 month services.
Brake Squeal
Not one bit of squeal or brake performance issue so far. Not saying it won�t happen, but nothing has materialised yet. Discs are clean and pads look 100% with no sign of accelerated wear.
Knocking Rear Top Mounts
Quiet and no noise. My car is a March 16 build date iirc, so not sure if that makes a difference. Again, no issues thus far.
The car had quite a heavy workout over the Highlands, but as of yet, none of the common issues have really reared their heads.
We�ll obviously see how this goes moving forward.
21 August 2016, 02:32 PM
#7
Scooby Regular
Thread Starter
Rear RS Badge
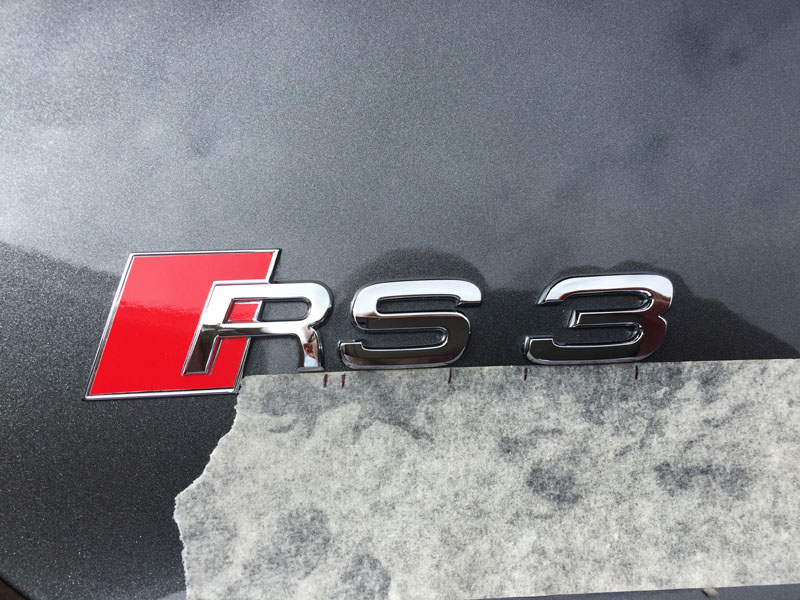
Decided to replace the rear RS3 badge today, with the black one recently purchased.
This time I wanted to mark the original badge out as this is a three piece badge.
All I did was mask below the original badge and mark where each specific character was…. Saves any guessing come positioning of the new one!
Same kind of deal as with the removal of the rear rings. Apply heat and then slip a credit card down, however, when it came to removing the R and red block that method didn’t work.
Due to that part of the badge being mega flush with the panel I had to use some dental floss (couldn’t get the card behind), which acted like a cheese wire. Just hook it around the top left hand corner and slower pull it behind the badge to the opposite corner. Comes off in seconds that way.
Once removed I cleaned it up as with the rings.
With the guide in place and the relevant marks, repositioning the new badge is really easy. The characters on the new badge were ever so slightly smaller, but it doesn’t make any different in reality.
I might be tempted to pull the rear exhaust tips off and get them powder coated in black, when I get the wheels done. Just to finish off the rear.
Due to get the car on the dyno this coming bank holiday weekend, fit the secondary decats and Tuning Box. That’s when I can get stuck into the logging and the real fun begins.
Trending Topics
21 August 2016, 07:14 PM
#8
Scooby Regular

Join Date: Jul 2014
Location: Staffordshire
Posts: 106
Likes: 0
Received 0 Likes
on
0 Posts
Subscribed.i took the new rs3 for a test drive saturday.i was very impressed.the only thing i noticed was for a 2.5 i thought it would spoil up slightly quicker from a standing start.i had the s3 last year with the dsg which as a all round car brilliant.the noise the 2.5 kicks out is stunning.is there a limit you can fettle with them before you lose the warrenty
29 August 2016, 07:41 AM
#9
Scooby Regular
Thread Starter
Not sure what you mean about spooling up from a standing start..... a stock RS3 can do the 60 dash in around 3.5s with rollout (3.7s ish without rollout) being taken into consideration. lol
Warranty could be void as soon as you do anything from stock mate..... like with any car. VAG are particularly strict on mods.
Warranty could be void as soon as you do anything from stock mate..... like with any car. VAG are particularly strict on mods.
 14 September 2016, 10:08 PM
#12
Scooby Regular
Thread Starter
I've taken the intro / explanation out of what I've posted elsewhere..... you guys have seen / read it all before. I'm just going to get down to the real meat here! 
TEST 1 - Baseline Figure
Apologies as I’m awaiting the separate stock graph PDF to be sent to me. I’ll update this as soon as I have it. The graph is used on some of the overlays seen further on, so at least we have clear reference points at the moment to discuss.
Summary of Spec
Standard MY16 RS3
Fuel - VPower Nitro (99 oct)
TEST 1 figure achieved was 388bhp & 350lbft @ the flywheel
TEST 1 - Baseline Figure - Comments
Well we already appreciate how quick this car is, even in standard form on the black stuff. But in reality this is due to a number of things. The area under the curve, the gearbox and Haldex system - as a complete package it pretty much rocks, but what does the “pretty” graph tell us about the power delivery.
The area under the curve is always more relevant than the peak figures.
I can normally look at an entire power graph and make a decent judgement as to the potential of the power delivery and flexibility on the road, taking into account the power band and torque available. Make no mistake, it’s the torque that gets you to where you want to go…. Quicker.
Since the MAHA RR is able to appropriately load the engine up, you can deduce how the turbo comes on song. You can see here that you’re achieving near (around 340lbft) peak torque at around 2600rpm, which in 4th gear is pretty good. Suffice to say, due to loading, you will see peak torque coming in slightly earlier the higher the gear. So 5th would see this 2800rpm drop slightly….. this is all normal (3rd gear would be slightly later and so on).
Low rpm’s for torque makes for more pace from lower revs, however by looking at this torque curve you see the RS3 holds this torque pretty well all the way through to 5800rpm. For a road car that is a nice torque band. This is why the mid-range feels really strong on the RS3 and explains why the engine keeps pulling through the rev range. When you combine a wide torque band, with an early onset of torque, you end up with a very agile package.
There are a few peaks and troughs throughout the torque curve, but these don’t really “get in the way” of the power delivery. We’ll come on this later.
When we also see how much more power/torque this turbo can provide further on, it makes the overall set-up even more amazing.
So what else can we find out?
Another advantage of most rolling roads is that you can also capture and overlay other data, that is gathered at the time of the dyno run. This data either comes from plugging the dyno into your OBD port, or buy connecting additional sensors to the dyno, directly connected to the car.
I did capture a lot of data on all runs but it was a mix between additional sensors (true wide band sensor), ODB to dyno and also using VCDS. Which leads me on to the next subject….
VCDS (previously known as VAGCOM)
I won’t bore you guys with talking about what VCDS is…. I’m suspecting most of you guys know, but what I will concentrate on is talking about the logging facilities as this was the real reason why I purchased VCDS.
In basic terms the ECU reads a varied number of sensors (some dependant on OEM ECU version). Upon looking at the sensor readings available via VCDS, you may be overwhelmed by what data sets can be logged.
You may be thinking why I can’t just plug in a simple OBD reader into the car and use a smartphone app etc to read the sensors. The main constraint with this is that these loggers / scanners only read generic OBD codes (PID’s) generally. Some applications will also decipher / read manufacturer specific codes, but not to the extent that VCDS does. VCDS reads all the VAG sensors that I’m aware of, and it’s access to this information that I wanted.
Whilst some may be meaningful, others will have the reaction of "What the hell does that mean?". Obviously to a professional or knowledgeable enthusiast, this will equate to useful data but in reality the majority of us will neither understand or be interested to a degree...... but make no mistake they can all be meaningful.
Here is a screenshot of a log I took (excuse the rather slow sample rate - that’s my fault) for the stock level of tune.
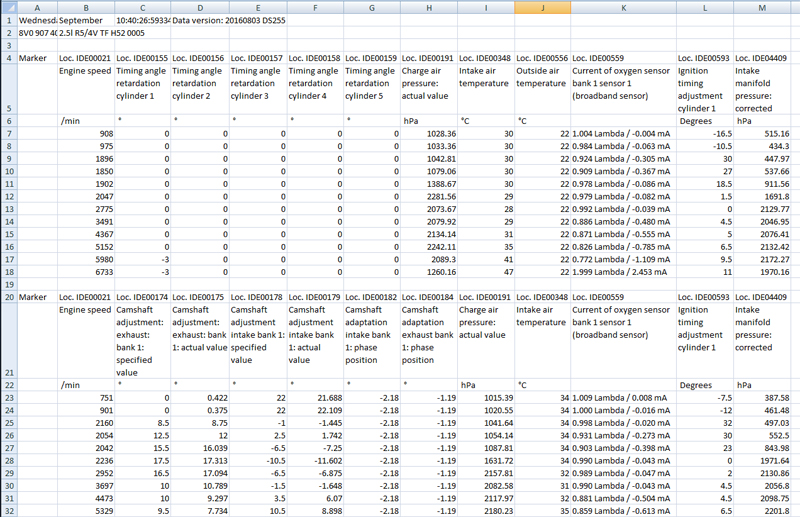
This specific screen shot shows two logs in the same file.
They both contain all sorts of data varying from timing retard per cylinder, boost, charge air temp and ambient temps, fueling, overall ignition, camshaft timing etc. You can view all sorts of useful date which is very very useful (needed) when you’re mapping. All of these are normally recorded against RPM.
There are so many different sensors and you can log up to 12 different sensors at a time in VCDS.
Stock Boost
As we’re talking about the stock tune here, you can use the screenshot above to see how much boost the car makes on a stock tune as seen at the manifold.
If you look at the Engine Speed column on the left (uppermost log) and scan across to the last column (Intake Manifold Pressure), you’ll see what boost was achieved at what RPM. Whilst the sample rate is quite slow (as in the RPM increments), this does give you a good idea of boost attained at the manifold.
You must remember that the boost shown includes 1 atmosphere of measure as these are absolute readings, so you must take 1 atmosphere (1 bar effectively) off to get an appropriate reading. These are also shown in hPa as opposed to PSI or BAR. 1000 hPa is basically 1 bar, so it doesn’t take long to work it all out.
I’ll do the conversion to BAR to make it easier for you to read:
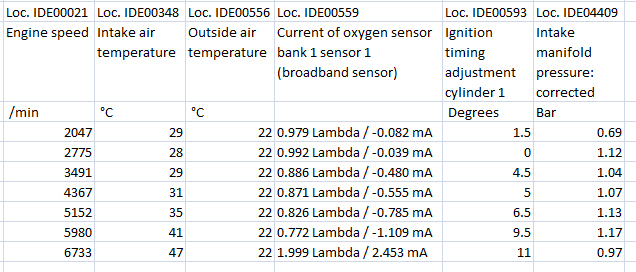
Whilst it doesn’t show it in this log, stock boost peaks at around 1.2bar, but you can see that boost does fluctuate throughout the rev range. This is also shown in the torque curve, which for a standard car isn’t that flat to be honest. On the stock dyno runs of the RS3 you can see the torque (and power) fluctuate through the mid range, and this is largely due to boost fluctuation / control. Boost control could have been tighter to be honest, but it is what it is.
As you may expect, you can see boost tails off towards the redline (just below 1bar).
Charge Temp
Something else you can see on the above log is the Intake Air Temp which is the temperature of the air after the intercooler. This is very important for turbocharged cars and is certainly an area that can cost you power as well as gain you power.
Effectively the cooler the air entering the engine after the turbocharger (and intercooler), the more dense it is and the the bigger bang you can achieve. Figures you attain here can inform you whether you’re over heating the charge air (by running the turbo beyond its efficiency) and/or have an effective intercooler.
It’s also useful to log the ambient temperatures so you can see the delta (difference) between the two temps.
You’ll see here that the charge temp (intake) is fairly OK, but rises as the run moves through the revs and more boost is being applied and everything heats up.
Cooler charge temps are the best (icing issues to one side), but I was always told in the old days that ideally you should aim for charge temps below 40degs. Anything over that will apparently start to impact power more.
Considering this is a dyno cell, and although it has very good airflow, it can’t match the cooling the car would receive on the road, so the figures attained here on the oem setup are OK. Repeated dyno pulls will start to increase temps, but on the runs we did they quickly stabilised again.
Fuelling
Again on the same log above you’ll see fuelling being logged (shown by the column giving a Lambda reading). Ignoring the last row @ 6733 (the throttle was lifted here), the Lambda figure slowly decreases as the revs rise. This means the fuelling starts off lean (more air than fuel) and gradually richens up (more fuel) as the power / boost rises. What you would expect.
It is possible to gain power (and lose it) depending on what fueling strategy you choose. Rich or lean mixtures have their benefits and disbenefits. However, I’m led to believe that with direct injection (as used in the RS3), you have much more flexibility with what you can do with the fuelling.
Ignition
The final element to highlight is the ignition adjustment, which is also on the same log above.
Again, as the rev rise and boost builds the ignition is slowly adjusted, with stock peak ignition adjustment running at around 11degs of advance.
All the above are the basic elements to consider when tuning a turbocharged car. There are a lot more, certainly in this ECU on the RS3, but these are the basics. But you’ll probably appreciate now how important log information can be, especially when you’re looking to start tuning a car.
So with the benchmark data logged and the car pulled off the dyno…. Let’s move on to the first item to change.
Secondary Decats
Quite a common mod on the RS3 so I thought it would be rude not to.
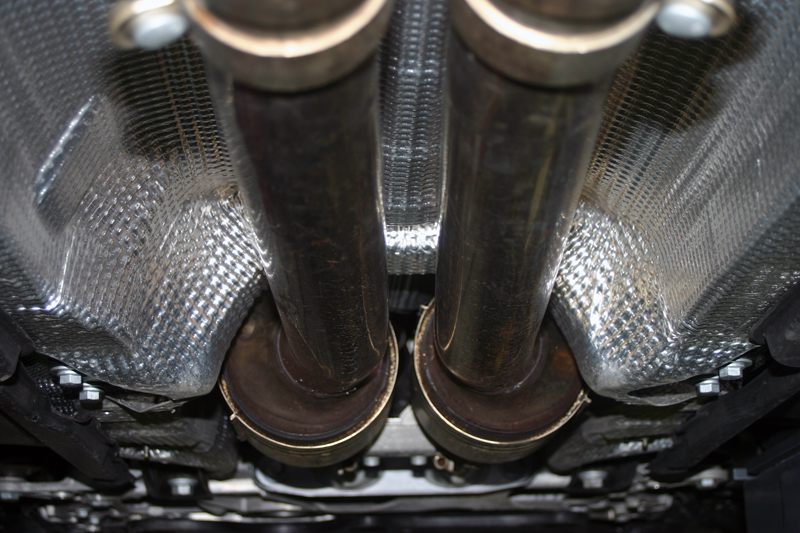
The RS3 has several cats, both in the downpipe and the secondary mid section. It’s the secondary ones I decided to remove as it’s a fairly straight forward and inexpensive mod.
To be honest the OEM exhaust system doesn’t look that restrictive visually, but may need to be looked at further down the line.
You’d have thought that removing a couple of cats would release some power. We’ll find out.
The main reason I chose this mod was for the noise increase though. Whilst the stock car sounds very nice, I wanted to unleash that rumble a touch more. If we saw any increase in power that would be a bonus, but it wasn’t really expected from my perspective.
These are what we’re going to remove:
These are what we’re going to replace them with, a set of Miltek secondary decat pipes:
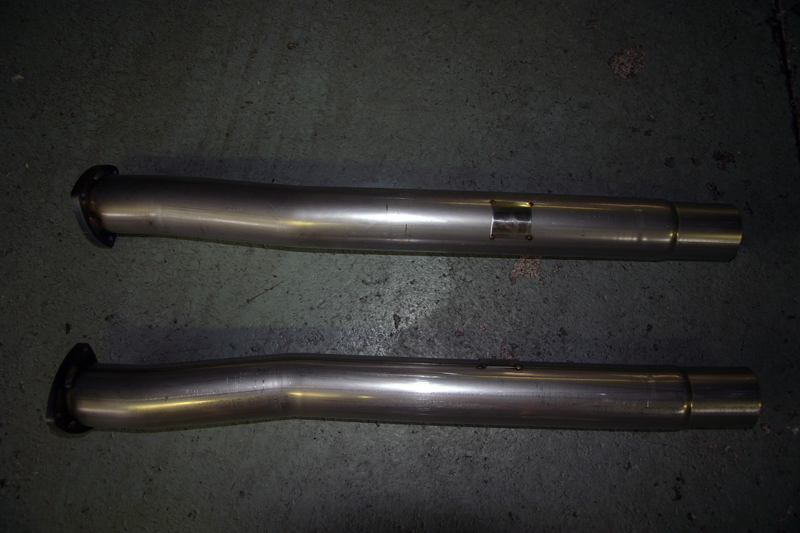
With both sets side by side:
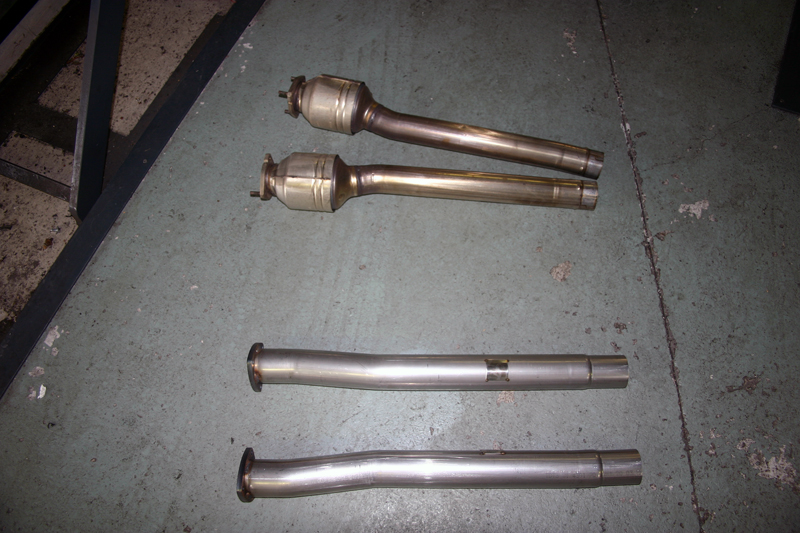
It’s clearly quite obvious what the difference is between the two sets of pipes!
So with the new decats on, it was time to bang the car on the dyno and see what we could see.
TEST 1 - Secondary Decats
Apologies as I’m awaiting the decta graph PDF to be sent to me. I’ll update this as soon as I have it.
Summary of Spec
MY16 RS3
Miltek Secondary Decat Pipes
Fuel - VPower Nitro (99 oct)
TEST 1 figure achieved was 394bhp & 355lbft @ flywheel
Because I haven’t got the graph in front of me I don’t have the exact figures (again apologies), but from what I remember we saw circa +6bhp and +5lbft over stock. I can’t remember whether this was only peak or throughout the rev range though. I’ll update when I get the graph in my hands.
I know others have reported more increases, but unfortunately I can only state what I
achieved. To be honest I’m not surprised.
Looking at my VCDS logs it doesn’t appear to have affected boost control, which if there was less of a restriction on the exhaust side by a tangible amount, I would expect to see changes in wastegate duty / boost achieved.
It’s sounded awesome on the dyno though….. It has a proper “growl on” when you open it up. Worth the cost 100% just for that in my opinion!
I was going to disconnect the exhaust valves as well, but never got around to it. I might revisit that in the future.
I also can’t tell you whether driveability was affected, not that I would expect this to be the case in reality to any noticeable degree. The first time I got the car on the road was after the next stage of tuning….. Which we’ll come on to next and something I’m sure you guys will be more interested in.
ECU Remap
This is undoubtedly the key element for this development phase and where most of the time has been spent.
The RS3 uses the Bosch MED 17.1.x ECU family…… without going into a massive amount of detail, this ECU is one very powerful ****. The amount of control it can have over how the engine performs is pretty mind blowing. The art of making the car “sing”, utilising/modifying the appropriate calibrations (there are well over 100,000 of these!) and ensuring you’re not hitting the protection tables (ultimately resulting in power being pulled down), is where the time and effort is needed.
It goes without saying that even from a pure technical and in essence, logical standpoint, a properly mapped ECU should be overall, far better than a tuning box (convenience to one side).
One of the plus sides of mapping the MED 17.1.x is the fact that this can be accessed fully via the OBD port. I don’t personally know if all current tuners are using this method, I suspect they are to be honest. The other method (as is the case with the A45) is via a method known as BDM. The process to achieve this is commonly referred to as a “bench tune”, which effectively means the ECU is pulled out of the car and programmed. This also makes tuning a bit of a time consuming effort, assuming you need to alter and test different calibration adjustments. It means you program the ECU (out of the car and you normally open it up); refit; log on road/dyno; pull ECU out and make adjustments and refit/log again - repeat until you get bored!
Fortunately the RS3 has OBD programming access.
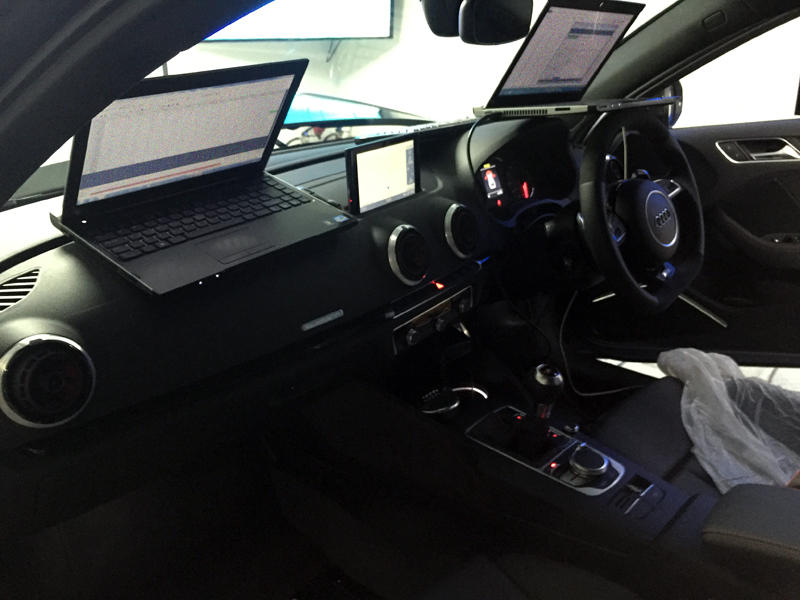
So how is the programming done - put simply a laptop with the programming software is connected to the ECU via the cars OBD port, and the new map file is written to the ECU…. all in situ. It takes around 10 minutes to reprogram the ECU with each new map file.
Enough screens for you?
TEST 2 - ECU Remap and Secondary Decats
Whilst I’m reporting this as TEST 2, there was a whole process that we went through to get to this point. This was certainly not the first map that was created (in fact it was the last one of the day), but was where we finished up at the end of this specific session. If memory serves me correctly we created at least 7 maps, each one altering a single area to see what the effect was, then rolling up the “good” changes with the next change. Basically taking an incremental approach.
Summary of Spec
MY16 RS3
Litchfield Stage 1 ECU calibration
Miltek Secondary Decat Pipes
Fuel - VPower Nitro (99 oct)
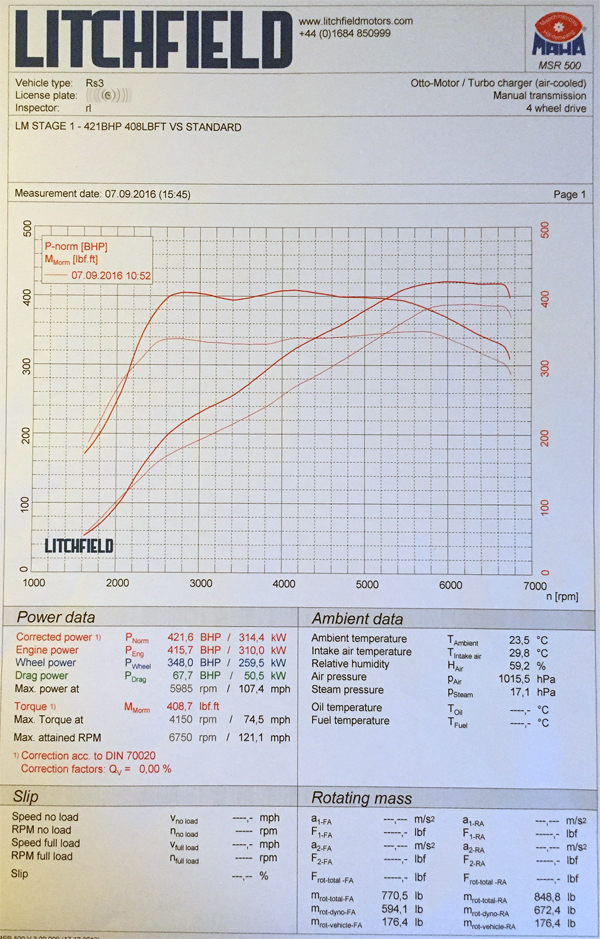
TEST 2 figure achieved was 421.6bhp & 408.7lbft @ flywheel
Comparing this against the stock figure (which is the comparison the graph above shows) we saw the following:
+33.6 bhp +58.7 lbft (peak) over stock
+8.6% bhp +16.7% lbft (peak) over stock
I’ve banged on about this before (probably), but in my experience of using most makes of dynos in the UK over the years, I have always found MAHA dynos to provide quite a stingy torque figure…. Certainly in comparison to other dyno makes. So it’s worth bearing this in mind when you compare figures. Which is seen here with the stock figures as much as the tuned figures in my opinion. But it is what it is.
TEST 2 - Comments
I certainly know I’ve said this before, but one thing that is very important in my opinion, is to not just focus on peak power figures. You really need to look at the whole rev range and thus the whole area UNDER the curve to appreciate improvements.
Considering this was after the initial mapping session, and whilst the peak figures attained are good, there are higher improvements being seen in the mid range.
Looking at the graph you can see that whilst torque is by and large a nice increase throughout the mid range by around +60lbft, the power is seeing increases through the mid range of +50 bhp.
To me, for a road car, it’s about torque and mid range grunt.
TEST 2 - Road
Yeah….. That’s different!
I’ve always thought the stock RS3 was already quick, which is in part down to it’s power delivery and smoothness. This map just amplified the stock delivery, whilst retaining the stock characteristics. This map almost felt too smooth though, however, smooth delivery can mean in reality a quick car!
The car was certainly more urgent in the mid range (increased torque) and felt like it was pulling harder at the top end.
Being honest I suppose I was expecting more. Don’t know why though. Although expectation is normally high when going through a tuning process, but let’s be honest, this map was far from finished. So I needed to put things into perspective.
It felt good and quicker, but just didn’t blow my socks off. But then will Stage 1 ever do that. We’re all greedy aren't we!
The noise……
Initially I didn’t think there was much of a difference on the road, but when you start driving a bit more, you really do notice the bigger growl. Because the RS3 switches the exhaust flaps dependant on throttle, it is more or less as before until you open it up….. Then it really does sounds awesome. Something I have noticed is perhaps a very slight drone now at cruise 70-80mph. It’s only very slight and I can’t say I noticed it before. It’s certainly a great and cheap mod to make in my opinion. These engines sound awesome…. These decat pipes just makes it sound that much more awesome!
It was agreed to carry on with the mapping development in a couple of days time.
TEST 3 - Revised ECU Remap and Secondary Decats
So, the second session of mapping commenced. First off we took a Day 2 baseline run just to ensure that we were still where we left off on the previous session. This run was within a couple of BHP of where we were at the end of Day 1 (as per TEST 2), so we were good to go.
Again, just to go through the process we followed…. On Day 2 we took the map (currently on the car) from the end of Day 1 and called that Stage 1 v1. During this session we went through a similar task as the previous session, carrying on where we left off. During this session we created 9 new maps, although the last revision didn’t make any positive difference so we reverted back to the v8 map from this session. Litchfield’s had already created 6 new maps prior, and we created 3 additional new ones on the day (using what was learnt during this specific session).
We were on the dyno for around 4 hours for this session.
Summary of Spec
MY16 RS3
Litchfield Stage 1 ECU calibration
Miltek Secondary Decat Pipes
Fuel - VPower Nitro (99 oct)
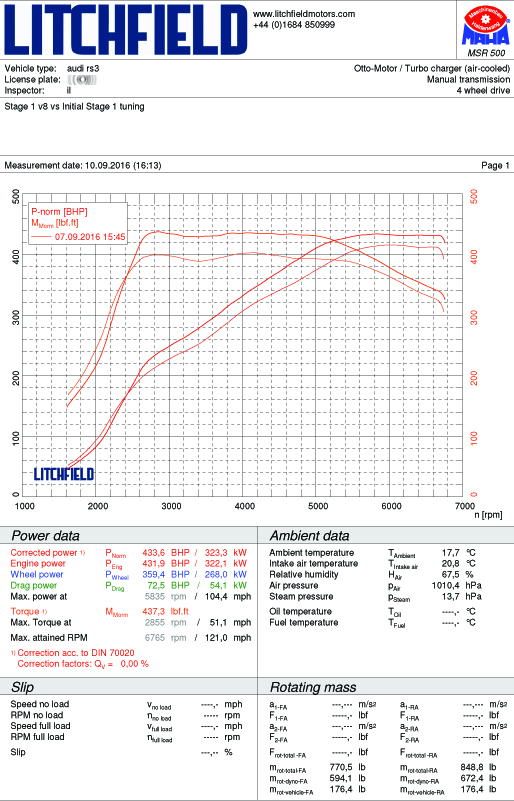
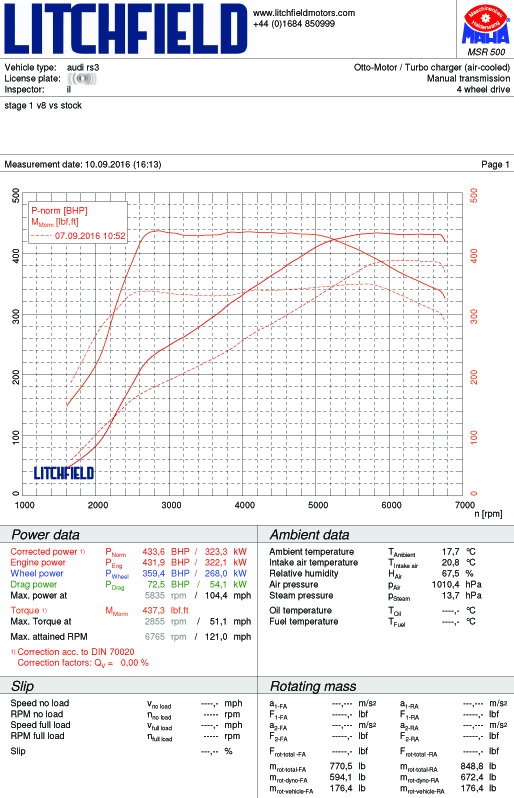
TEST 3 figure achieved was 433.6bhp & 437.3lbft @ flywheel
Comparing this against TEST 2 figure (which is the comparison the graph above shows) we saw the following:
+12.0 bhp +28.6 lbft (peak) over TEST 2
+2.8% bhp +6.9% lbft (peak) over TEST 2
Overall Stage 1 Test 3 comparison against stock
+45.6 bhp +87.3 lbft (peak)
+11.7% bhp +24.9% lbft (peak)
TEST 3 - Comments
Obviously at this stage all I had to go by was the dyno data (and logs), but if you appreciate what a “good” road car dyno graph can look like, this is one of them in my opinion.
Two things to point out initially about the graph. One being the way the car was loaded up for this run. This is highlighted by the initial shape of the torque and power curve up to around 2150rpm. This isn’t a mapping issue which has caused this, this is purely because the car was not loaded on the dyno from a low enough rpm. It’s just the way this one was run (mistake by the dyno operator). It’s only that initial part of the run that was affected.
The second point (and I’m being really nit picking / **** here) is the very very slight dip (it’s probably in the region of 6lbft) in torque from 3-3800rpm. That is also replicated in the power curve for the same rpm. This is due to a very minor but further adjustment being needed to the boost control, as it looks like the ECU thinks it’s going to overboost just as it reaches initial peak boost, so it pulls back the boost slightly and then increases the boost again.
These two minor things to one side, this is such a smooth curve. The torque is virtually flat decked throughout the mid range. The power curve also looks so linear up to peak power, and then manages to hold that peak (virtually) through to the limiter.
If you compare the stock torque curve through the mid range, and even the torque curve result as part of the first mapping session, you will see that there is so much more control now in this area on this version of the map.
Even without getting the car on the road (which we did when we were happy with map, just to double check the logs on the black stuff), the curves alluded to a very nice driveable map.
As before let’s look at what increases have been seen through the mid range…..
In parts we’re talking +100 lbft and on average +90 lbft. With the BHP you’re seeing +80 bhp through a large amount of the same mid range. Those are some significant increases!
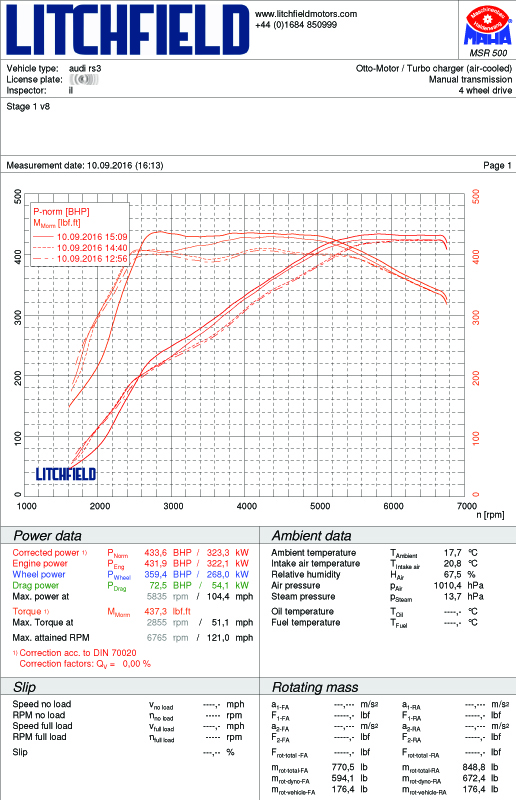
Due to time cracking on it was decided to call it a day….. For now.
For further context here is a dyno comparison of just a sample of the maps tested during this recent session. I won’t go into boring detail but you can see differences in the runs which were the outcome of the different maps. This was all part of the testing / learning process to end up with the final result.
TEST 3 - Road
Being honest I really wasn’t expecting much of a change on the road from the previous session map outcome. Perhaps I’d just desensitised myself. Lol
I fully appreciate this will be so subjective, but I thought I would just share the feedback I provided back to Iain after I go home. This is straight up and honest feedback, that was certainly never intended to be made public. But since this is what I felt / feel, I thought I would share.
“It's jeffing awesome mate.
I've never seen the traction control light coming on so much!!!! lol
I was genuinely laughing and smiling on the way home.
It's feels like a totally different car since Wednesday's map, which I wasn't expecting.
Whilst it's still very smooth and the gearbox just sucks everything up you give it, the way the power comes in (urgency and magnitude) on a low rpm pull is fantastic. With the A45 it felt you had to properly wind it up (they are pretty much at the same peak figure level now). With this though, it's much more responsive and instant.
You can feel a big improvement both in the midrange and top end since Wednesday. It feels quite exciting when you keep your foot in, which it didn't on Wednesday. Mid range feels very smooth.... but it feels like it's pulling so hard.
Top end feels like it's giving measurable improvements over Wednesday.
I look forward to your further map tweaks!!!! Get mashing that keyboard!!!!”
To be honest I’m not going to add anything else. I could keep banging on about how it feels etc but there is little point wasting bandwidth! lol
For me that’s Stage 1 done and dusted.
I intend to get down the quarter mile again this weekend and also carry out some VBOX logging. As and when I get these performance measures I’ll update this thread. It will be interesting to see where the car is in relation to my stock performance data.
Stage 2 will begin in a couple of weeks…. So expect more news on that very soon!
TEST 1 - Baseline Figure
Apologies as I’m awaiting the separate stock graph PDF to be sent to me. I’ll update this as soon as I have it. The graph is used on some of the overlays seen further on, so at least we have clear reference points at the moment to discuss.
Summary of Spec
Standard MY16 RS3
Fuel - VPower Nitro (99 oct)
TEST 1 figure achieved was 388bhp & 350lbft @ the flywheel
TEST 1 - Baseline Figure - Comments
Well we already appreciate how quick this car is, even in standard form on the black stuff. But in reality this is due to a number of things. The area under the curve, the gearbox and Haldex system - as a complete package it pretty much rocks, but what does the “pretty” graph tell us about the power delivery.
The area under the curve is always more relevant than the peak figures.
I can normally look at an entire power graph and make a decent judgement as to the potential of the power delivery and flexibility on the road, taking into account the power band and torque available. Make no mistake, it’s the torque that gets you to where you want to go…. Quicker.
Since the MAHA RR is able to appropriately load the engine up, you can deduce how the turbo comes on song. You can see here that you’re achieving near (around 340lbft) peak torque at around 2600rpm, which in 4th gear is pretty good. Suffice to say, due to loading, you will see peak torque coming in slightly earlier the higher the gear. So 5th would see this 2800rpm drop slightly….. this is all normal (3rd gear would be slightly later and so on).
Low rpm’s for torque makes for more pace from lower revs, however by looking at this torque curve you see the RS3 holds this torque pretty well all the way through to 5800rpm. For a road car that is a nice torque band. This is why the mid-range feels really strong on the RS3 and explains why the engine keeps pulling through the rev range. When you combine a wide torque band, with an early onset of torque, you end up with a very agile package.
There are a few peaks and troughs throughout the torque curve, but these don’t really “get in the way” of the power delivery. We’ll come on this later.
When we also see how much more power/torque this turbo can provide further on, it makes the overall set-up even more amazing.
So what else can we find out?
Another advantage of most rolling roads is that you can also capture and overlay other data, that is gathered at the time of the dyno run. This data either comes from plugging the dyno into your OBD port, or buy connecting additional sensors to the dyno, directly connected to the car.
I did capture a lot of data on all runs but it was a mix between additional sensors (true wide band sensor), ODB to dyno and also using VCDS. Which leads me on to the next subject….
VCDS (previously known as VAGCOM)
I won’t bore you guys with talking about what VCDS is…. I’m suspecting most of you guys know, but what I will concentrate on is talking about the logging facilities as this was the real reason why I purchased VCDS.
In basic terms the ECU reads a varied number of sensors (some dependant on OEM ECU version). Upon looking at the sensor readings available via VCDS, you may be overwhelmed by what data sets can be logged.
You may be thinking why I can’t just plug in a simple OBD reader into the car and use a smartphone app etc to read the sensors. The main constraint with this is that these loggers / scanners only read generic OBD codes (PID’s) generally. Some applications will also decipher / read manufacturer specific codes, but not to the extent that VCDS does. VCDS reads all the VAG sensors that I’m aware of, and it’s access to this information that I wanted.
Whilst some may be meaningful, others will have the reaction of "What the hell does that mean?". Obviously to a professional or knowledgeable enthusiast, this will equate to useful data but in reality the majority of us will neither understand or be interested to a degree...... but make no mistake they can all be meaningful.
Here is a screenshot of a log I took (excuse the rather slow sample rate - that’s my fault) for the stock level of tune.

This specific screen shot shows two logs in the same file.
They both contain all sorts of data varying from timing retard per cylinder, boost, charge air temp and ambient temps, fueling, overall ignition, camshaft timing etc. You can view all sorts of useful date which is very very useful (needed) when you’re mapping. All of these are normally recorded against RPM.
There are so many different sensors and you can log up to 12 different sensors at a time in VCDS.
Stock Boost
As we’re talking about the stock tune here, you can use the screenshot above to see how much boost the car makes on a stock tune as seen at the manifold.
If you look at the Engine Speed column on the left (uppermost log) and scan across to the last column (Intake Manifold Pressure), you’ll see what boost was achieved at what RPM. Whilst the sample rate is quite slow (as in the RPM increments), this does give you a good idea of boost attained at the manifold.
You must remember that the boost shown includes 1 atmosphere of measure as these are absolute readings, so you must take 1 atmosphere (1 bar effectively) off to get an appropriate reading. These are also shown in hPa as opposed to PSI or BAR. 1000 hPa is basically 1 bar, so it doesn’t take long to work it all out.
I’ll do the conversion to BAR to make it easier for you to read:

Whilst it doesn’t show it in this log, stock boost peaks at around 1.2bar, but you can see that boost does fluctuate throughout the rev range. This is also shown in the torque curve, which for a standard car isn’t that flat to be honest. On the stock dyno runs of the RS3 you can see the torque (and power) fluctuate through the mid range, and this is largely due to boost fluctuation / control. Boost control could have been tighter to be honest, but it is what it is.
As you may expect, you can see boost tails off towards the redline (just below 1bar).
Charge Temp
Something else you can see on the above log is the Intake Air Temp which is the temperature of the air after the intercooler. This is very important for turbocharged cars and is certainly an area that can cost you power as well as gain you power.
Effectively the cooler the air entering the engine after the turbocharger (and intercooler), the more dense it is and the the bigger bang you can achieve. Figures you attain here can inform you whether you’re over heating the charge air (by running the turbo beyond its efficiency) and/or have an effective intercooler.
It’s also useful to log the ambient temperatures so you can see the delta (difference) between the two temps.
You’ll see here that the charge temp (intake) is fairly OK, but rises as the run moves through the revs and more boost is being applied and everything heats up.
Cooler charge temps are the best (icing issues to one side), but I was always told in the old days that ideally you should aim for charge temps below 40degs. Anything over that will apparently start to impact power more.
Considering this is a dyno cell, and although it has very good airflow, it can’t match the cooling the car would receive on the road, so the figures attained here on the oem setup are OK. Repeated dyno pulls will start to increase temps, but on the runs we did they quickly stabilised again.
Fuelling
Again on the same log above you’ll see fuelling being logged (shown by the column giving a Lambda reading). Ignoring the last row @ 6733 (the throttle was lifted here), the Lambda figure slowly decreases as the revs rise. This means the fuelling starts off lean (more air than fuel) and gradually richens up (more fuel) as the power / boost rises. What you would expect.
It is possible to gain power (and lose it) depending on what fueling strategy you choose. Rich or lean mixtures have their benefits and disbenefits. However, I’m led to believe that with direct injection (as used in the RS3), you have much more flexibility with what you can do with the fuelling.
Ignition
The final element to highlight is the ignition adjustment, which is also on the same log above.
Again, as the rev rise and boost builds the ignition is slowly adjusted, with stock peak ignition adjustment running at around 11degs of advance.
All the above are the basic elements to consider when tuning a turbocharged car. There are a lot more, certainly in this ECU on the RS3, but these are the basics. But you’ll probably appreciate now how important log information can be, especially when you’re looking to start tuning a car.
So with the benchmark data logged and the car pulled off the dyno…. Let’s move on to the first item to change.
Secondary Decats
Quite a common mod on the RS3 so I thought it would be rude not to.
The RS3 has several cats, both in the downpipe and the secondary mid section. It’s the secondary ones I decided to remove as it’s a fairly straight forward and inexpensive mod.
To be honest the OEM exhaust system doesn’t look that restrictive visually, but may need to be looked at further down the line.
You’d have thought that removing a couple of cats would release some power. We’ll find out.
The main reason I chose this mod was for the noise increase though. Whilst the stock car sounds very nice, I wanted to unleash that rumble a touch more. If we saw any increase in power that would be a bonus, but it wasn’t really expected from my perspective.
These are what we’re going to remove:

These are what we’re going to replace them with, a set of Miltek secondary decat pipes:

With both sets side by side:

It’s clearly quite obvious what the difference is between the two sets of pipes!
So with the new decats on, it was time to bang the car on the dyno and see what we could see.
TEST 1 - Secondary Decats
Apologies as I’m awaiting the decta graph PDF to be sent to me. I’ll update this as soon as I have it.
Summary of Spec
MY16 RS3
Miltek Secondary Decat Pipes
Fuel - VPower Nitro (99 oct)
TEST 1 figure achieved was 394bhp & 355lbft @ flywheel
Because I haven’t got the graph in front of me I don’t have the exact figures (again apologies), but from what I remember we saw circa +6bhp and +5lbft over stock. I can’t remember whether this was only peak or throughout the rev range though. I’ll update when I get the graph in my hands.
I know others have reported more increases, but unfortunately I can only state what I
achieved. To be honest I’m not surprised.
Looking at my VCDS logs it doesn’t appear to have affected boost control, which if there was less of a restriction on the exhaust side by a tangible amount, I would expect to see changes in wastegate duty / boost achieved.
It’s sounded awesome on the dyno though….. It has a proper “growl on” when you open it up. Worth the cost 100% just for that in my opinion!
I was going to disconnect the exhaust valves as well, but never got around to it. I might revisit that in the future.
I also can’t tell you whether driveability was affected, not that I would expect this to be the case in reality to any noticeable degree. The first time I got the car on the road was after the next stage of tuning….. Which we’ll come on to next and something I’m sure you guys will be more interested in.
ECU Remap
This is undoubtedly the key element for this development phase and where most of the time has been spent.
The RS3 uses the Bosch MED 17.1.x ECU family…… without going into a massive amount of detail, this ECU is one very powerful ****. The amount of control it can have over how the engine performs is pretty mind blowing. The art of making the car “sing”, utilising/modifying the appropriate calibrations (there are well over 100,000 of these!) and ensuring you’re not hitting the protection tables (ultimately resulting in power being pulled down), is where the time and effort is needed.
It goes without saying that even from a pure technical and in essence, logical standpoint, a properly mapped ECU should be overall, far better than a tuning box (convenience to one side).
One of the plus sides of mapping the MED 17.1.x is the fact that this can be accessed fully via the OBD port. I don’t personally know if all current tuners are using this method, I suspect they are to be honest. The other method (as is the case with the A45) is via a method known as BDM. The process to achieve this is commonly referred to as a “bench tune”, which effectively means the ECU is pulled out of the car and programmed. This also makes tuning a bit of a time consuming effort, assuming you need to alter and test different calibration adjustments. It means you program the ECU (out of the car and you normally open it up); refit; log on road/dyno; pull ECU out and make adjustments and refit/log again - repeat until you get bored!
Fortunately the RS3 has OBD programming access.
So how is the programming done - put simply a laptop with the programming software is connected to the ECU via the cars OBD port, and the new map file is written to the ECU…. all in situ. It takes around 10 minutes to reprogram the ECU with each new map file.
Enough screens for you?

TEST 2 - ECU Remap and Secondary Decats
Whilst I’m reporting this as TEST 2, there was a whole process that we went through to get to this point. This was certainly not the first map that was created (in fact it was the last one of the day), but was where we finished up at the end of this specific session. If memory serves me correctly we created at least 7 maps, each one altering a single area to see what the effect was, then rolling up the “good” changes with the next change. Basically taking an incremental approach.

Summary of Spec
MY16 RS3
Litchfield Stage 1 ECU calibration
Miltek Secondary Decat Pipes
Fuel - VPower Nitro (99 oct)
TEST 2 figure achieved was 421.6bhp & 408.7lbft @ flywheel
Comparing this against the stock figure (which is the comparison the graph above shows) we saw the following:
+33.6 bhp +58.7 lbft (peak) over stock
+8.6% bhp +16.7% lbft (peak) over stock
I’ve banged on about this before (probably), but in my experience of using most makes of dynos in the UK over the years, I have always found MAHA dynos to provide quite a stingy torque figure…. Certainly in comparison to other dyno makes. So it’s worth bearing this in mind when you compare figures. Which is seen here with the stock figures as much as the tuned figures in my opinion. But it is what it is.
TEST 2 - Comments
I certainly know I’ve said this before, but one thing that is very important in my opinion, is to not just focus on peak power figures. You really need to look at the whole rev range and thus the whole area UNDER the curve to appreciate improvements.
Considering this was after the initial mapping session, and whilst the peak figures attained are good, there are higher improvements being seen in the mid range.
Looking at the graph you can see that whilst torque is by and large a nice increase throughout the mid range by around +60lbft, the power is seeing increases through the mid range of +50 bhp.
To me, for a road car, it’s about torque and mid range grunt.
TEST 2 - Road
Yeah….. That’s different!
I’ve always thought the stock RS3 was already quick, which is in part down to it’s power delivery and smoothness. This map just amplified the stock delivery, whilst retaining the stock characteristics. This map almost felt too smooth though, however, smooth delivery can mean in reality a quick car!
The car was certainly more urgent in the mid range (increased torque) and felt like it was pulling harder at the top end.
Being honest I suppose I was expecting more. Don’t know why though. Although expectation is normally high when going through a tuning process, but let’s be honest, this map was far from finished. So I needed to put things into perspective.
It felt good and quicker, but just didn’t blow my socks off. But then will Stage 1 ever do that. We’re all greedy aren't we!
The noise……
Initially I didn’t think there was much of a difference on the road, but when you start driving a bit more, you really do notice the bigger growl. Because the RS3 switches the exhaust flaps dependant on throttle, it is more or less as before until you open it up….. Then it really does sounds awesome. Something I have noticed is perhaps a very slight drone now at cruise 70-80mph. It’s only very slight and I can’t say I noticed it before. It’s certainly a great and cheap mod to make in my opinion. These engines sound awesome…. These decat pipes just makes it sound that much more awesome!
It was agreed to carry on with the mapping development in a couple of days time.
TEST 3 - Revised ECU Remap and Secondary Decats
So, the second session of mapping commenced. First off we took a Day 2 baseline run just to ensure that we were still where we left off on the previous session. This run was within a couple of BHP of where we were at the end of Day 1 (as per TEST 2), so we were good to go.
Again, just to go through the process we followed…. On Day 2 we took the map (currently on the car) from the end of Day 1 and called that Stage 1 v1. During this session we went through a similar task as the previous session, carrying on where we left off. During this session we created 9 new maps, although the last revision didn’t make any positive difference so we reverted back to the v8 map from this session. Litchfield’s had already created 6 new maps prior, and we created 3 additional new ones on the day (using what was learnt during this specific session).
We were on the dyno for around 4 hours for this session.

Summary of Spec
MY16 RS3
Litchfield Stage 1 ECU calibration
Miltek Secondary Decat Pipes
Fuel - VPower Nitro (99 oct)
TEST 3 figure achieved was 433.6bhp & 437.3lbft @ flywheel
Comparing this against TEST 2 figure (which is the comparison the graph above shows) we saw the following:
+12.0 bhp +28.6 lbft (peak) over TEST 2
+2.8% bhp +6.9% lbft (peak) over TEST 2
Overall Stage 1 Test 3 comparison against stock
+45.6 bhp +87.3 lbft (peak)
+11.7% bhp +24.9% lbft (peak)

TEST 3 - Comments
Obviously at this stage all I had to go by was the dyno data (and logs), but if you appreciate what a “good” road car dyno graph can look like, this is one of them in my opinion.
Two things to point out initially about the graph. One being the way the car was loaded up for this run. This is highlighted by the initial shape of the torque and power curve up to around 2150rpm. This isn’t a mapping issue which has caused this, this is purely because the car was not loaded on the dyno from a low enough rpm. It’s just the way this one was run (mistake by the dyno operator). It’s only that initial part of the run that was affected.
The second point (and I’m being really nit picking / **** here) is the very very slight dip (it’s probably in the region of 6lbft) in torque from 3-3800rpm. That is also replicated in the power curve for the same rpm. This is due to a very minor but further adjustment being needed to the boost control, as it looks like the ECU thinks it’s going to overboost just as it reaches initial peak boost, so it pulls back the boost slightly and then increases the boost again.
These two minor things to one side, this is such a smooth curve. The torque is virtually flat decked throughout the mid range. The power curve also looks so linear up to peak power, and then manages to hold that peak (virtually) through to the limiter.
If you compare the stock torque curve through the mid range, and even the torque curve result as part of the first mapping session, you will see that there is so much more control now in this area on this version of the map.
Even without getting the car on the road (which we did when we were happy with map, just to double check the logs on the black stuff), the curves alluded to a very nice driveable map.
As before let’s look at what increases have been seen through the mid range…..
In parts we’re talking +100 lbft and on average +90 lbft. With the BHP you’re seeing +80 bhp through a large amount of the same mid range. Those are some significant increases!
Due to time cracking on it was decided to call it a day….. For now.
For further context here is a dyno comparison of just a sample of the maps tested during this recent session. I won’t go into boring detail but you can see differences in the runs which were the outcome of the different maps. This was all part of the testing / learning process to end up with the final result.

TEST 3 - Road
Being honest I really wasn’t expecting much of a change on the road from the previous session map outcome. Perhaps I’d just desensitised myself. Lol
I fully appreciate this will be so subjective, but I thought I would just share the feedback I provided back to Iain after I go home. This is straight up and honest feedback, that was certainly never intended to be made public. But since this is what I felt / feel, I thought I would share.
“It's jeffing awesome mate.
I've never seen the traction control light coming on so much!!!! lol
I was genuinely laughing and smiling on the way home.
It's feels like a totally different car since Wednesday's map, which I wasn't expecting.
Whilst it's still very smooth and the gearbox just sucks everything up you give it, the way the power comes in (urgency and magnitude) on a low rpm pull is fantastic. With the A45 it felt you had to properly wind it up (they are pretty much at the same peak figure level now). With this though, it's much more responsive and instant.
You can feel a big improvement both in the midrange and top end since Wednesday. It feels quite exciting when you keep your foot in, which it didn't on Wednesday. Mid range feels very smooth.... but it feels like it's pulling so hard.
Top end feels like it's giving measurable improvements over Wednesday.
I look forward to your further map tweaks!!!! Get mashing that keyboard!!!!”
To be honest I’m not going to add anything else. I could keep banging on about how it feels etc but there is little point wasting bandwidth! lol
For me that’s Stage 1 done and dusted.
I intend to get down the quarter mile again this weekend and also carry out some VBOX logging. As and when I get these performance measures I’ll update this thread. It will be interesting to see where the car is in relation to my stock performance data.
Stage 2 will begin in a couple of weeks…. So expect more news on that very soon!
18 September 2016, 08:17 PM
#13
Scooby Regular
Thread Starter
Performance Testing - Stock vs Stage 1
It’s alright having dyno graphs but this is all about (in my opinion) how any power relates to performance on the black stuff.
I don’t tend to drive my car on the dyno to work and back, so it’s always good to use other forms of reference to measure changes.
Something I will do throughout this project is give you the good, the bad and the ugly. This is all about a journey and things won’t always go to plan etc…. That’s life especially with car tuning. Hopefully negative things will be infrequent though.
So what are we going to use to benchmark performance at this level of tuning…. Acceleration runs, specifically down the quarter of a mile.
I’ve already mentioned about using a VBOX to measure acceleration, so that will certainly be used and I’ve also ran the car down Santa Pod dragstrip when it was stock. So we’ll use that as another means to judge performance.
VBOX Data
Some of you may take the data I will provide in this update and immediately compare it against other data available on the net. Whilst it is fine to do that, you do need to be very careful that you’re comparing apples with apples.
The fact is that you can get VBOX data from any location you choose. Some of those locations maybe uphill or downhill. Some of the data captured may actually be corrupt. When you use a VBOX and look at the screen for the results gained, that won’t tell you ANYTHING about the integrity of the data and run. I know it’s 100% possible to log a run on a VBOX that is both downhill and has dropped satellite connection part way through the run….. Both of these elements can GREATLY influence the figures given by just using the onboard screen of the VBOX.
How do you verify that the data and run is pucka?
You must ensure a memory card is in the VBOX to store the logs and check the data validity on both the desktop software that comes with the VBOX and using an online tool called “VBOX Verify”.
VBOX Verify will do just that….. It will check the data file is clean and that the run is performed within an accepted “slope” tolerance. What the later means is that it will measure the slope of the road (height data is captured all the way through the run), by ensuring that it remains within a certain % allowed throughout the run.
However…. There’s even more to it than this.
Whilst there is a slope check you can still gain acceleration performance by running on a road ,that whilst still falls within the acceptable slope (downhill for instance), does give the run an advantage. That’s physics! When you’re looking to compare figures that are coming down to 10ths of a second difference…. It can all help to make that difference.
This sounds all really ****…. But again, when you’re comparing down to 10ths of a second, it can make an impact.
Context and accuracy is king in my opinion and you need to be as like for like as possible. So be very careful when you compare data you’ve attained against others.
Dragstrip accuracy - surely that’s a give then?
If it’s a proper dragstrip then at least you be assured that the timing slip will be accurate, however, there is more to it than this.
Just because you run on a dragstrip it doesn’t mean your performance data (time and terminal speeds) will not vary between different dragstrips. You also can’t guarantee that each time you run, your car will absolutely run the same times.
Assuming your car is healthy, so much can influence a drag run when you’re hunting those small 10ths of a second.
Preparation of the track can make a difference (grip and drag). Weather conditions can make a difference.
In my opinion the environment and weather can have the biggest impact when comparing data. Some cars may be impacted more than others.
Just don’t take everything literally. It’s not that black and white.
Vehicle Weight
Vehicle weight can also influence acceleration times, as the power to weight maybe different. If your car is fully loaded with the “fat” options, there is every chance that a lighter specced car will perform better. Based on the options available I think the difference in times will be small, but every little counts when you’re getting the magnifying glass out on performance figures.
Again….. Something else to be aware of.
Mine is a full fat version, but I do need to get in on the scales to find out exactly what that means.
Conditions on the day
The ambients were good being in mid teens. The cooler the air the better it should be for turbocharged cars.
Track preparation wasn’t the best. Due to rain the previous day and earlier that morning, together with the cooler air, grip for me was an issue. Something I never experienced a few months ago…. However, I’ve also got more grunt now, so that certainly wouldn’t help with the standing starts. It is what it is though.
There was also quite a strong crosswind. Again that isn’t going to help matters. Although it’s better than a direct headwind!
There were LOADS of cars running. So much that we were queuing out the end of the fire up lane. It was a good 30mins between runs. This means that whatever heat you’ve built up in your tyres will dissipate by the time you get to the start line (less grip), and you also have the added awesome feature of heat soak due to queuing! The OEM intercooler is starting to struggle with a remap on the RS3, so any additional heat build up isn’t going to help matters.
You can only run in the conditions that are apparent on the day though. Such is life.
First run 12.14 @ 114.33mph
I wasn’t expecting today to go well if I’m being honest, as the conditions weren’t the best. This first run gave an indication to how the day was possibly going to pan out.
Grip wasn’t good. Wheelspin at the start together with axle tramping. That isn’t good. More grunt and not enough grip on a standing start.
I also noticed the gearbox appeared to stutter from 1st to 2nd and 2nd to 3rd. 3rd to 4th was fine.
Second run 12.08 @ 114.63mph
Still had traction problems and gearbox stutters, but at least the time was coming down.
Third run 11.98 @ 113.63mph
This run had a better launch, but still span the fronts wheels up. No axle tramp and the stutters weren’t appearing on the gear changes. The track felt like it was starting to improve (this was just after 2pm).
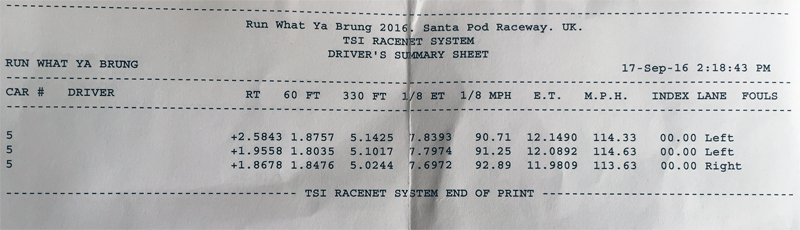
Positives
I’d be lying if I stated I wasn’t hoping for more, however, that was in relation to the ET’s and I was hoping for an 11.8x. We’re talking about a 10th of a second here and considering the grip issues I had experienced, the 11.9x achieved is a solid measure.
My car clearly has more grunt now than it did before when stock. If we look at my best from the previous stock figures at Santa Pod, to these runs, the differences are marked in both ET’s and terminal speeds:
Stock
12.34 @ 111.25mph; 60ft in 1.83s; 330ft in 5.13; ⅛ in 7.92 @ 88.75
Stage 1
11.98 @ 113.63mph; 60ft in 1.84s; 330ft in 5.02; ⅛ in 7.69 @ 92.89
Taking into account my other two runs from yesterday were seeing terminals @ 114mph, this backs up the dyno after figures with the increased BHP at the top end. The car is quicker down the strip because of this.
At the level of Stage 1 on these cars you’re not going to see massive decreases in times, as the top end BHP isn’t being lifted that much over the stock figures.
Also the extra torque this Stage 1 now has won’t be benefiting the drag runs as much as they benefit the car on the road in normal driving conditions. The mid range will only be utilised through the first gear, where this can impact grip anyway. There is also less load in 1st so the benefit of the mid range is limited. Drag runs are really about the upper rev band.
Negatives
The biggest negative is overall grip on launching. This is probably a combination of the track conditions and my hefty torque in the midrange on that 1st gear pull from a standing start with launch control.
I’m also on the thinner 235 section tyres at the front. Most owners will have the 255’s on the front. This should theoretically aid traction from a launch.
Whilst run stability improved on the third run, I never saw a 60ft in the 1.7’s, which is absolutely possible with these RS3’s. When my car was stock I saw a 1.75s 60ft…. And I’m not the only one.
We’re getting quite **** here and this car is not being modified to be a drag monster…. It’s a road car and is setup as such.
What’s next?
The next dragstrip event is at Shakespeare Raceway this coming weekend. I’m going to try and attend and see if I can get the car in 11.8’s. I’m not going to change anything on the car, but may play with tyre pressures to see if I can stabilize the grip more on launching. Lower pressures normally aid grip, but that will increase the drag and decrease my speed….. So it’s a balancing act.
Apart from this it’s on to Stage 2. Intercooler and remap again! Then hopefully back down to strip to see if this helps my overall performance figures.
Talking of performance figures
What about my VBOX data from these runs!..........
Here is the verified VBOX data from the above quickest drag run at Santa Pod. Remember this is from a drag strip run…… not a road log:
0-60mph in 3.50s
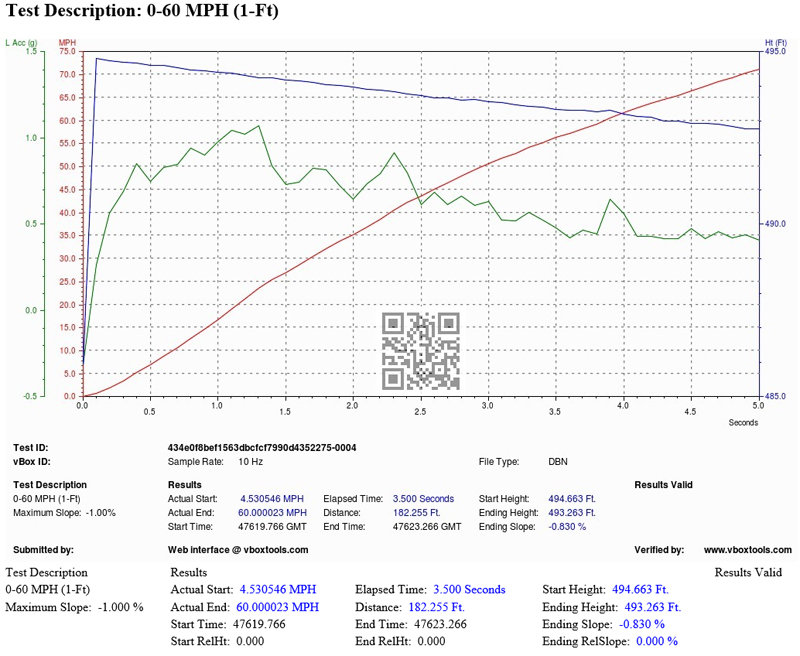
60-100mph in 5.31s
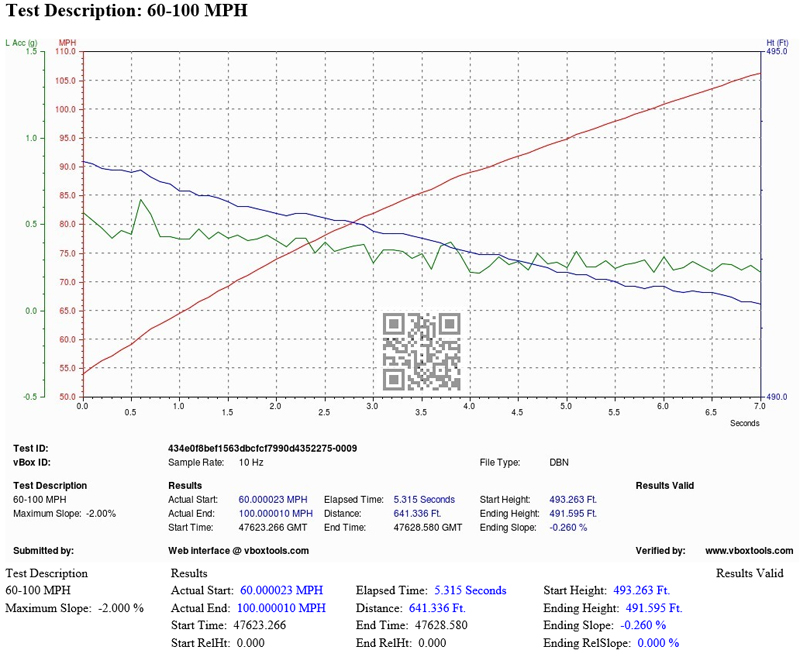
0-100mph in 8.81s
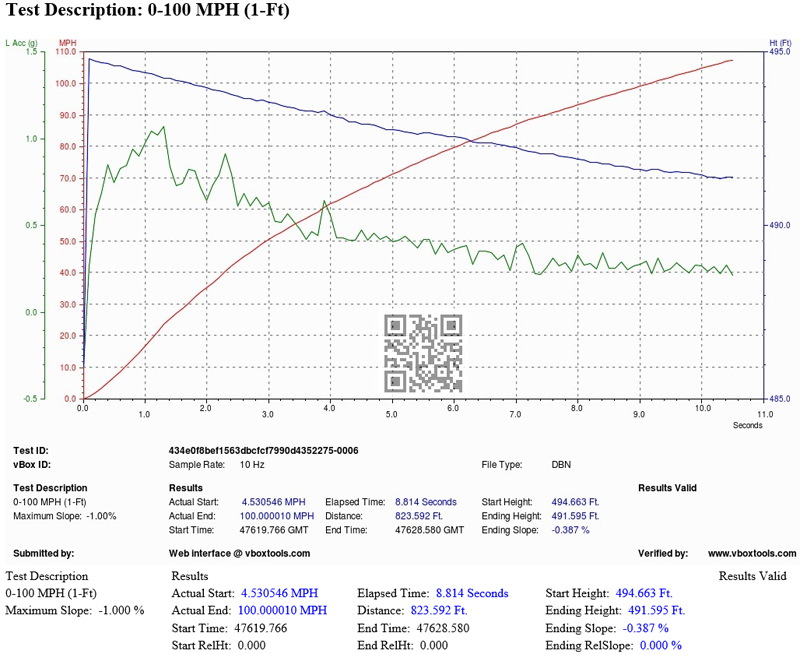
If you wondered how accurate these VBOX’s are…. Look at this VBOX log taken on my quickest run. Pretty close to the official strip timing for a box that costs a few hundred pounds!
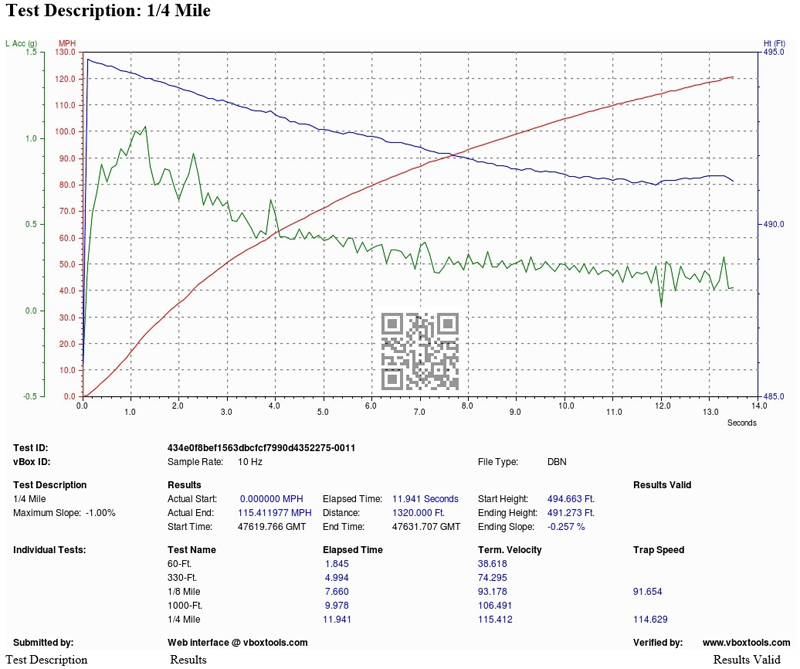
Here’s the quickest run on video:
https://www.youtube.com/watch?v=d16F...ature=youtu.be
 23 September 2016, 02:43 PM
#15
Scooby Regular

Performance Testing - Stock vs Stage 1
It�s alright having dyno graphs but this is all about (in my opinion) how any power relates to performance on the black stuff.
I don�t tend to drive my car on the dyno to work and back, so it�s always good to use other forms of reference to measure changes.
Something I will do throughout this project is give you the good, the bad and the ugly. This is all about a journey and things won�t always go to plan etc�. That�s life especially with car tuning. Hopefully negative things will be infrequent though.
So what are we going to use to benchmark performance at this level of tuning�. Acceleration runs, specifically down the quarter of a mile.
I�ve already mentioned about using a VBOX to measure acceleration, so that will certainly be used and I�ve also ran the car down Santa Pod dragstrip when it was stock. So we�ll use that as another means to judge performance.
VBOX Data
Some of you may take the data I will provide in this update and immediately compare it against other data available on the net. Whilst it is fine to do that, you do need to be very careful that you�re comparing apples with apples.
The fact is that you can get VBOX data from any location you choose. Some of those locations maybe uphill or downhill. Some of the data captured may actually be corrupt. When you use a VBOX and look at the screen for the results gained, that won�t tell you ANYTHING about the integrity of the data and run. I know it�s 100% possible to log a run on a VBOX that is both downhill and has dropped satellite connection part way through the run�.. Both of these elements can GREATLY influence the figures given by just using the onboard screen of the VBOX.
How do you verify that the data and run is pucka?
You must ensure a memory card is in the VBOX to store the logs and check the data validity on both the desktop software that comes with the VBOX and using an online tool called �VBOX Verify�.
VBOX Verify will do just that�.. It will check the data file is clean and that the run is performed within an accepted �slope� tolerance. What the later means is that it will measure the slope of the road (height data is captured all the way through the run), by ensuring that it remains within a certain % allowed throughout the run.
However�. There�s even more to it than this.
Whilst there is a slope check you can still gain acceleration performance by running on a road ,that whilst still falls within the acceptable slope (downhill for instance), does give the run an advantage. That�s physics! When you�re looking to compare figures that are coming down to 10ths of a second difference�. It can all help to make that difference.
This sounds all really ****�. But again, when you�re comparing down to 10ths of a second, it can make an impact.
Context and accuracy is king in my opinion and you need to be as like for like as possible. So be very careful when you compare data you�ve attained against others.
Dragstrip accuracy - surely that�s a give then?
If it�s a proper dragstrip then at least you be assured that the timing slip will be accurate, however, there is more to it than this.
Just because you run on a dragstrip it doesn�t mean your performance data (time and terminal speeds) will not vary between different dragstrips. You also can�t guarantee that each time you run, your car will absolutely run the same times.
Assuming your car is healthy, so much can influence a drag run when you�re hunting those small 10ths of a second.
Preparation of the track can make a difference (grip and drag). Weather conditions can make a difference.
In my opinion the environment and weather can have the biggest impact when comparing data. Some cars may be impacted more than others.
Just don�t take everything literally. It�s not that black and white.
Vehicle Weight
Vehicle weight can also influence acceleration times, as the power to weight maybe different. If your car is fully loaded with the �fat� options, there is every chance that a lighter specced car will perform better. Based on the options available I think the difference in times will be small, but every little counts when you�re getting the magnifying glass out on performance figures.
Again�.. Something else to be aware of.
Mine is a full fat version, but I do need to get in on the scales to find out exactly what that means.
Conditions on the day
The ambients were good being in mid teens. The cooler the air the better it should be for turbocharged cars.
Track preparation wasn�t the best. Due to rain the previous day and earlier that morning, together with the cooler air, grip for me was an issue. Something I never experienced a few months ago�. However, I�ve also got more grunt now, so that certainly wouldn�t help with the standing starts. It is what it is though.
There was also quite a strong crosswind. Again that isn�t going to help matters. Although it�s better than a direct headwind!
There were LOADS of cars running. So much that we were queuing out the end of the fire up lane. It was a good 30mins between runs. This means that whatever heat you�ve built up in your tyres will dissipate by the time you get to the start line (less grip), and you also have the added awesome feature of heat soak due to queuing! The OEM intercooler is starting to struggle with a remap on the RS3, so any additional heat build up isn�t going to help matters.
You can only run in the conditions that are apparent on the day though. Such is life.
First run 12.14 @ 114.33mph
I wasn�t expecting today to go well if I�m being honest, as the conditions weren�t the best. This first run gave an indication to how the day was possibly going to pan out.
Grip wasn�t good. Wheelspin at the start together with axle tramping. That isn�t good. More grunt and not enough grip on a standing start.
I also noticed the gearbox appeared to stutter from 1st to 2nd and 2nd to 3rd. 3rd to 4th was fine.
Second run 12.08 @ 114.63mph
Still had traction problems and gearbox stutters, but at least the time was coming down.
Third run 11.98 @ 113.63mph
This run had a better launch, but still span the fronts wheels up. No axle tramp and the stutters weren�t appearing on the gear changes. The track felt like it was starting to improve (this was just after 2pm).
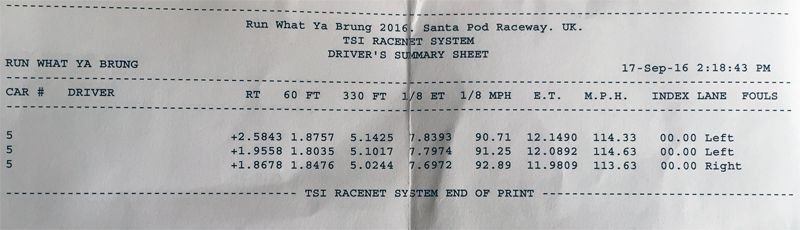
Positives
I�d be lying if I stated I wasn�t hoping for more, however, that was in relation to the ET�s and I was hoping for an 11.8x. We�re talking about a 10th of a second here and considering the grip issues I had experienced, the 11.9x achieved is a solid measure.
My car clearly has more grunt now than it did before when stock. If we look at my best from the previous stock figures at Santa Pod, to these runs, the differences are marked in both ET�s and terminal speeds:
Stock
12.34 @ 111.25mph; 60ft in 1.83s; 330ft in 5.13; ⅛ in 7.92 @ 88.75
Stage 1
11.98 @ 113.63mph; 60ft in 1.84s; 330ft in 5.02; ⅛ in 7.69 @ 92.89
Taking into account my other two runs from yesterday were seeing terminals @ 114mph, this backs up the dyno after figures with the increased BHP at the top end. The car is quicker down the strip because of this.
At the level of Stage 1 on these cars you�re not going to see massive decreases in times, as the top end BHP isn�t being lifted that much over the stock figures.
Also the extra torque this Stage 1 now has won�t be benefiting the drag runs as much as they benefit the car on the road in normal driving conditions. The mid range will only be utilised through the first gear, where this can impact grip anyway. There is also less load in 1st so the benefit of the mid range is limited. Drag runs are really about the upper rev band.
Negatives
The biggest negative is overall grip on launching. This is probably a combination of the track conditions and my hefty torque in the midrange on that 1st gear pull from a standing start with launch control.
I�m also on the thinner 235 section tyres at the front. Most owners will have the 255�s on the front. This should theoretically aid traction from a launch.
Whilst run stability improved on the third run, I never saw a 60ft in the 1.7�s, which is absolutely possible with these RS3�s. When my car was stock I saw a 1.75s 60ft�. And I�m not the only one.
We�re getting quite **** here and this car is not being modified to be a drag monster�. It�s a road car and is setup as such.
What�s next?
The next dragstrip event is at Shakespeare Raceway this coming weekend. I�m going to try and attend and see if I can get the car in 11.8�s. I�m not going to change anything on the car, but may play with tyre pressures to see if I can stabilize the grip more on launching. Lower pressures normally aid grip, but that will increase the drag and decrease my speed�.. So it�s a balancing act.
Apart from this it�s on to Stage 2. Intercooler and remap again! Then hopefully back down to strip to see if this helps my overall performance figures.
Talking of performance figures
What about my VBOX data from these runs!..........
Here is the verified VBOX data from the above quickest drag run at Santa Pod. Remember this is from a drag strip run�� not a road log:
0-60mph in 3.50s
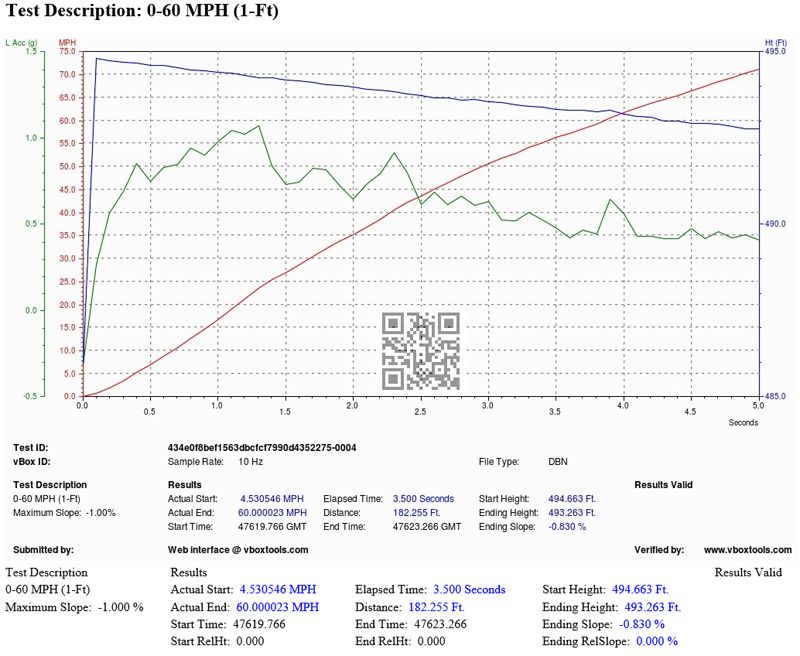
60-100mph in 5.31s
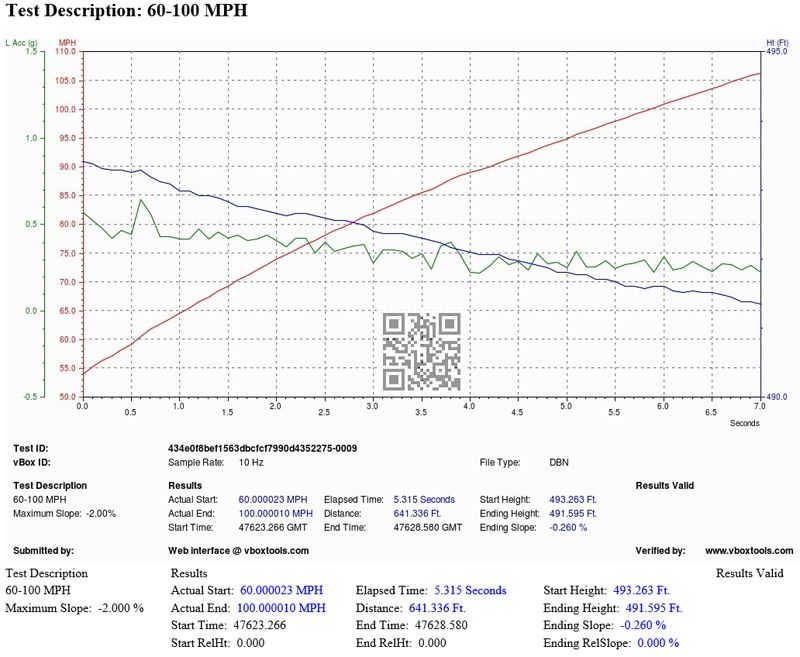
0-100mph in 8.81s
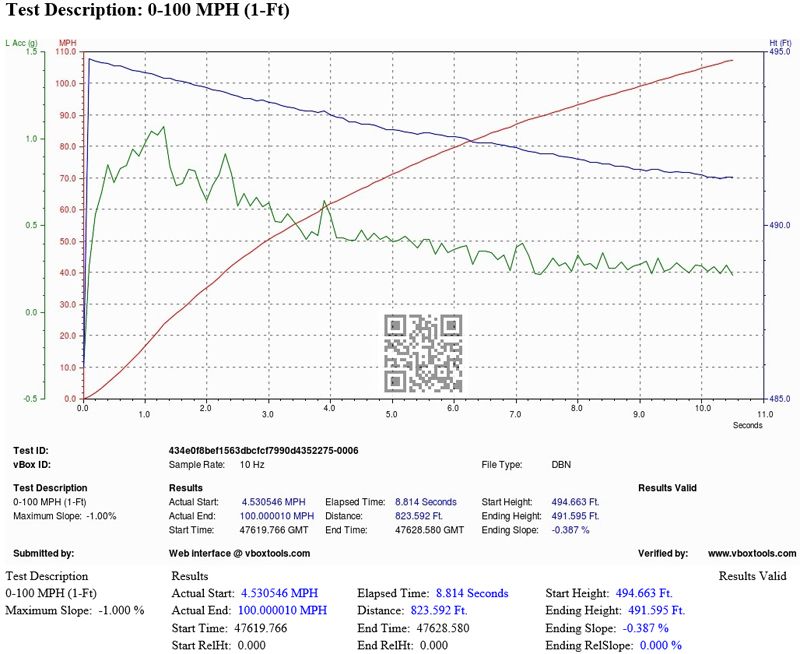
If you wondered how accurate these VBOX�s are�. Look at this VBOX log taken on my quickest run. Pretty close to the official strip timing for a box that costs a few hundred pounds!
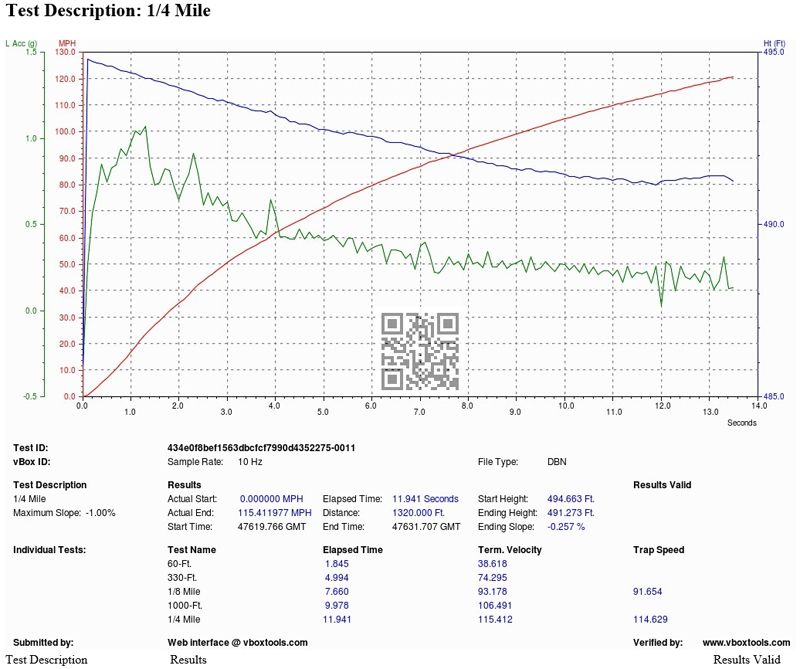
Here�s the quickest run on video:
https://www.youtube.com/watch?v=d16F...ature=youtu.be
It�s alright having dyno graphs but this is all about (in my opinion) how any power relates to performance on the black stuff.
I don�t tend to drive my car on the dyno to work and back, so it�s always good to use other forms of reference to measure changes.
Something I will do throughout this project is give you the good, the bad and the ugly. This is all about a journey and things won�t always go to plan etc�. That�s life especially with car tuning. Hopefully negative things will be infrequent though.
So what are we going to use to benchmark performance at this level of tuning�. Acceleration runs, specifically down the quarter of a mile.
I�ve already mentioned about using a VBOX to measure acceleration, so that will certainly be used and I�ve also ran the car down Santa Pod dragstrip when it was stock. So we�ll use that as another means to judge performance.
VBOX Data
Some of you may take the data I will provide in this update and immediately compare it against other data available on the net. Whilst it is fine to do that, you do need to be very careful that you�re comparing apples with apples.
The fact is that you can get VBOX data from any location you choose. Some of those locations maybe uphill or downhill. Some of the data captured may actually be corrupt. When you use a VBOX and look at the screen for the results gained, that won�t tell you ANYTHING about the integrity of the data and run. I know it�s 100% possible to log a run on a VBOX that is both downhill and has dropped satellite connection part way through the run�.. Both of these elements can GREATLY influence the figures given by just using the onboard screen of the VBOX.
How do you verify that the data and run is pucka?
You must ensure a memory card is in the VBOX to store the logs and check the data validity on both the desktop software that comes with the VBOX and using an online tool called �VBOX Verify�.
VBOX Verify will do just that�.. It will check the data file is clean and that the run is performed within an accepted �slope� tolerance. What the later means is that it will measure the slope of the road (height data is captured all the way through the run), by ensuring that it remains within a certain % allowed throughout the run.
However�. There�s even more to it than this.
Whilst there is a slope check you can still gain acceleration performance by running on a road ,that whilst still falls within the acceptable slope (downhill for instance), does give the run an advantage. That�s physics! When you�re looking to compare figures that are coming down to 10ths of a second difference�. It can all help to make that difference.
This sounds all really ****�. But again, when you�re comparing down to 10ths of a second, it can make an impact.
Context and accuracy is king in my opinion and you need to be as like for like as possible. So be very careful when you compare data you�ve attained against others.
Dragstrip accuracy - surely that�s a give then?
If it�s a proper dragstrip then at least you be assured that the timing slip will be accurate, however, there is more to it than this.
Just because you run on a dragstrip it doesn�t mean your performance data (time and terminal speeds) will not vary between different dragstrips. You also can�t guarantee that each time you run, your car will absolutely run the same times.
Assuming your car is healthy, so much can influence a drag run when you�re hunting those small 10ths of a second.
Preparation of the track can make a difference (grip and drag). Weather conditions can make a difference.
In my opinion the environment and weather can have the biggest impact when comparing data. Some cars may be impacted more than others.
Just don�t take everything literally. It�s not that black and white.
Vehicle Weight
Vehicle weight can also influence acceleration times, as the power to weight maybe different. If your car is fully loaded with the �fat� options, there is every chance that a lighter specced car will perform better. Based on the options available I think the difference in times will be small, but every little counts when you�re getting the magnifying glass out on performance figures.
Again�.. Something else to be aware of.
Mine is a full fat version, but I do need to get in on the scales to find out exactly what that means.
Conditions on the day
The ambients were good being in mid teens. The cooler the air the better it should be for turbocharged cars.
Track preparation wasn�t the best. Due to rain the previous day and earlier that morning, together with the cooler air, grip for me was an issue. Something I never experienced a few months ago�. However, I�ve also got more grunt now, so that certainly wouldn�t help with the standing starts. It is what it is though.
There was also quite a strong crosswind. Again that isn�t going to help matters. Although it�s better than a direct headwind!
There were LOADS of cars running. So much that we were queuing out the end of the fire up lane. It was a good 30mins between runs. This means that whatever heat you�ve built up in your tyres will dissipate by the time you get to the start line (less grip), and you also have the added awesome feature of heat soak due to queuing! The OEM intercooler is starting to struggle with a remap on the RS3, so any additional heat build up isn�t going to help matters.
You can only run in the conditions that are apparent on the day though. Such is life.
First run 12.14 @ 114.33mph
I wasn�t expecting today to go well if I�m being honest, as the conditions weren�t the best. This first run gave an indication to how the day was possibly going to pan out.
Grip wasn�t good. Wheelspin at the start together with axle tramping. That isn�t good. More grunt and not enough grip on a standing start.
I also noticed the gearbox appeared to stutter from 1st to 2nd and 2nd to 3rd. 3rd to 4th was fine.
Second run 12.08 @ 114.63mph
Still had traction problems and gearbox stutters, but at least the time was coming down.
Third run 11.98 @ 113.63mph
This run had a better launch, but still span the fronts wheels up. No axle tramp and the stutters weren�t appearing on the gear changes. The track felt like it was starting to improve (this was just after 2pm).
Positives
I�d be lying if I stated I wasn�t hoping for more, however, that was in relation to the ET�s and I was hoping for an 11.8x. We�re talking about a 10th of a second here and considering the grip issues I had experienced, the 11.9x achieved is a solid measure.
My car clearly has more grunt now than it did before when stock. If we look at my best from the previous stock figures at Santa Pod, to these runs, the differences are marked in both ET�s and terminal speeds:
Stock
12.34 @ 111.25mph; 60ft in 1.83s; 330ft in 5.13; ⅛ in 7.92 @ 88.75
Stage 1
11.98 @ 113.63mph; 60ft in 1.84s; 330ft in 5.02; ⅛ in 7.69 @ 92.89
Taking into account my other two runs from yesterday were seeing terminals @ 114mph, this backs up the dyno after figures with the increased BHP at the top end. The car is quicker down the strip because of this.
At the level of Stage 1 on these cars you�re not going to see massive decreases in times, as the top end BHP isn�t being lifted that much over the stock figures.
Also the extra torque this Stage 1 now has won�t be benefiting the drag runs as much as they benefit the car on the road in normal driving conditions. The mid range will only be utilised through the first gear, where this can impact grip anyway. There is also less load in 1st so the benefit of the mid range is limited. Drag runs are really about the upper rev band.
Negatives
The biggest negative is overall grip on launching. This is probably a combination of the track conditions and my hefty torque in the midrange on that 1st gear pull from a standing start with launch control.
I�m also on the thinner 235 section tyres at the front. Most owners will have the 255�s on the front. This should theoretically aid traction from a launch.
Whilst run stability improved on the third run, I never saw a 60ft in the 1.7�s, which is absolutely possible with these RS3�s. When my car was stock I saw a 1.75s 60ft�. And I�m not the only one.
We�re getting quite **** here and this car is not being modified to be a drag monster�. It�s a road car and is setup as such.
What�s next?
The next dragstrip event is at Shakespeare Raceway this coming weekend. I�m going to try and attend and see if I can get the car in 11.8�s. I�m not going to change anything on the car, but may play with tyre pressures to see if I can stabilize the grip more on launching. Lower pressures normally aid grip, but that will increase the drag and decrease my speed�.. So it�s a balancing act.
Apart from this it�s on to Stage 2. Intercooler and remap again! Then hopefully back down to strip to see if this helps my overall performance figures.
Talking of performance figures
What about my VBOX data from these runs!..........
Here is the verified VBOX data from the above quickest drag run at Santa Pod. Remember this is from a drag strip run�� not a road log:
0-60mph in 3.50s
60-100mph in 5.31s
0-100mph in 8.81s
If you wondered how accurate these VBOX�s are�. Look at this VBOX log taken on my quickest run. Pretty close to the official strip timing for a box that costs a few hundred pounds!
Here�s the quickest run on video:
https://www.youtube.com/watch?v=d16F...ature=youtu.be
 25 September 2016, 02:12 PM
#17
Scooby Regular
Thread Starter
Performance Testing Stage 1 - Round 2
I did say on the last update that I would be attending the next dragstrip event at Shakespeare Raceway� so here we are!
I was adamant that the conditions at Santa Pod last weekend were not the best, and for me, caused issues due to poor grip levels. Like we all say though�. The bull**** stops when the flag drops, so I was eager to try again under better track conditions.
Conditions on the day
The ambients were warmer today than last weekend high teens starting off, which quickly moved to low 20�s.
Track preparation should be better as the weather leading up to today wasn�t that bad. It was at least dry the day before and no rain had fallen overnight.
As soon as I got to the track they were already out prepping it which is always a good sign!
Another good thing (from a run / heat management perspective) is that there were no where near as many runners here today as Santa Pod the week before. Which should mean I can better manage my runs, rather than being dictated by the traffic.
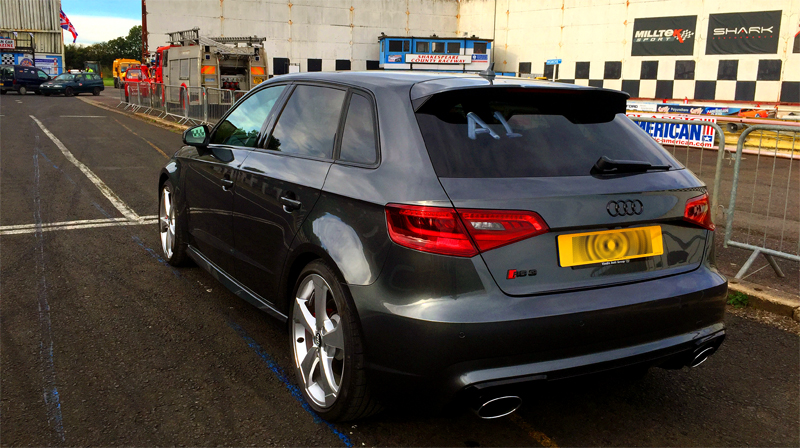
First run 11.99 @ 114.64 60ft 1.87s
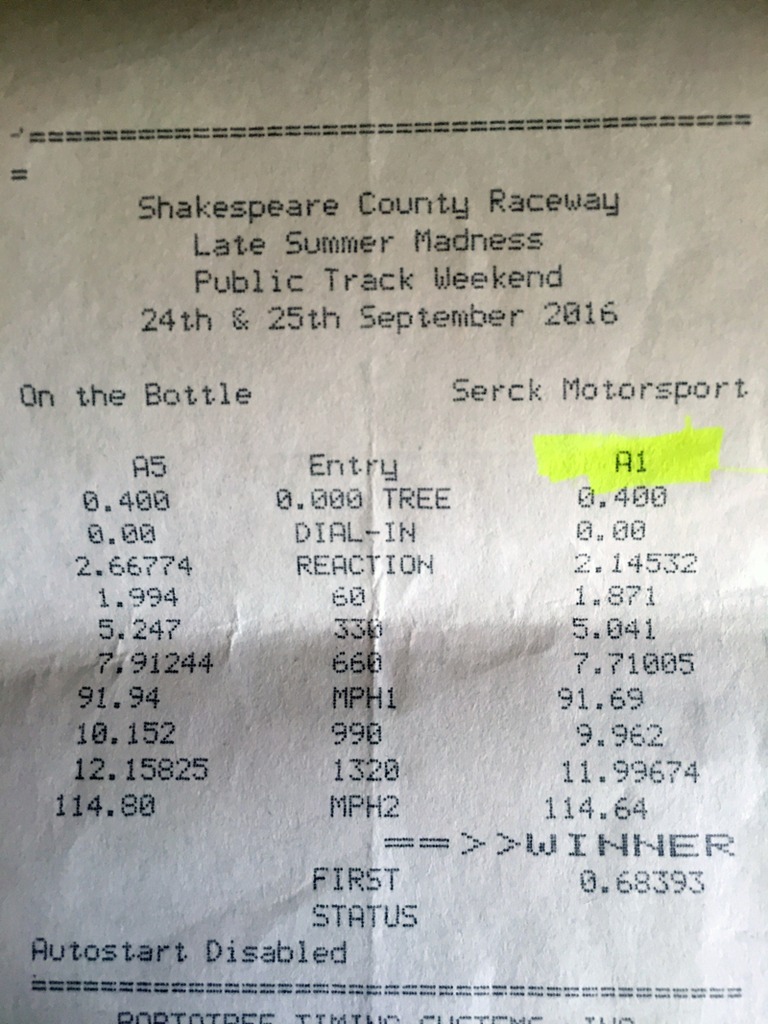
I�m going to start and quote the 60ft in the title. This is very important to me now as you�ll see further on.
*****�.. It�s lighting up the front tyres again and still axle tramping. Car feels really light going up the rest of the track as well.
This is the first run though and I was first on track�.. I�m hoping things will improve as the track gets more rubber and heat into it.
I�m going to get straight back on, back to back!
Second run 12.06 @ 114.82 60ft 1.94s
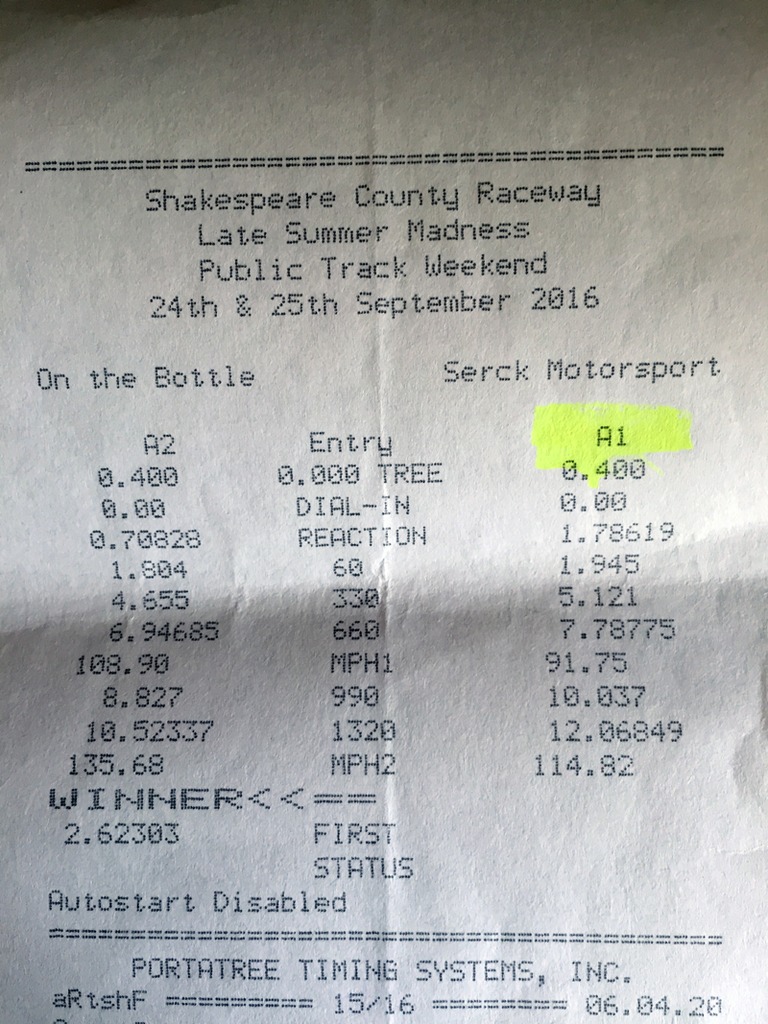
Holy moley�. What happened on that run. Look at that 60ft!
Front grip was atrocious! Still feels like it�s struggling for grip over the rest of the track as well. It�s 4WD�. What�s going on! lol
One more run, but something to try first to improve grip�.
Tyre Pressures
I�m adamant this is all about grip and not because my tune hasn�t got the power.
I normally, as a matter of course, pull tyre pressure down on the fronts for drag runs on a Haldex type setup and all round if it�s permanent 4WD. This is assuming I�m having grip problems and I want to try and help with this.
The downside to pulling out tyre pressure is that this normally negatively affects the speeds you attain. This is due to increased tyre drag, with more of the tyre (as it�s effectively flatter) spread on the tarmac.
In my opinion if you�re not having grip issues don�t mess with your tyre pressures. One of the guys running his stock RS3 at the pod last weekend did this. He wasn�t having grip issues, but with him pulling his tyre pressures down it reduced his terminal speeds by a couple of MPH. His ET�s were not really affected, but this is what it normally does.
Checking my pressures I was still running stock levels for 235�s on the front, which was 39psi. I pulled these down to 32psi at the front and left the rears stock. It�s the fronts that are having to cope with all the work in reality.
Third run 11.98 @ 114.86 60ft 1.85s
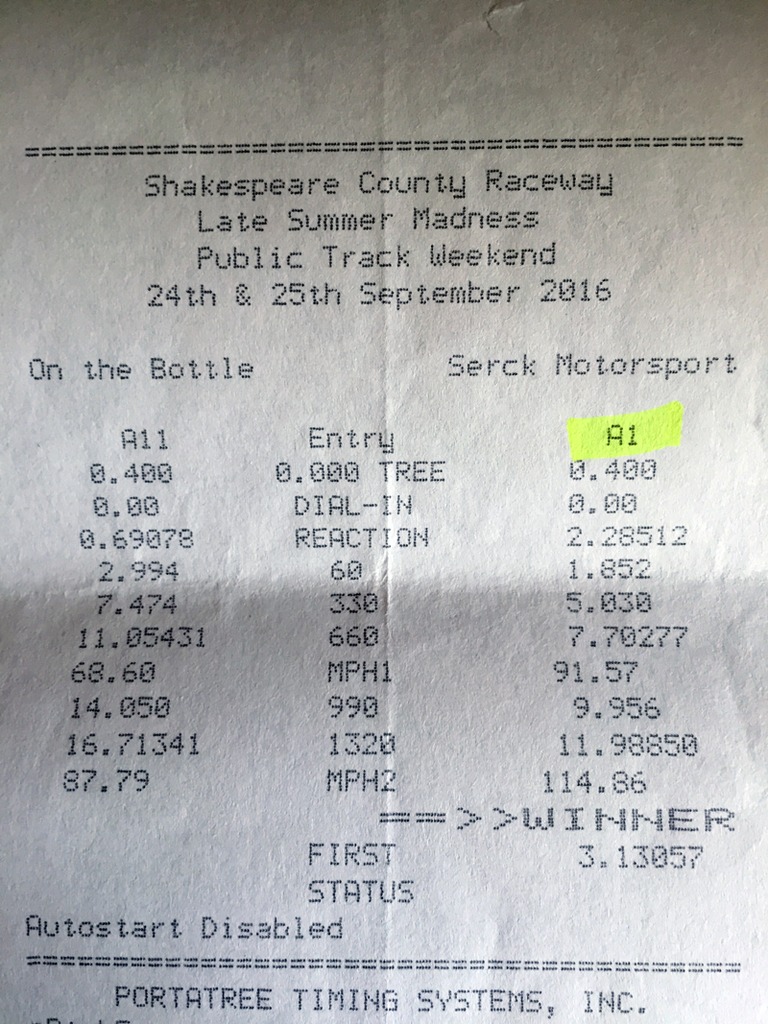
This is just as bad as Santa Pod�. I just don�t think I�m going to get anywhere today.
At this point I decided to rest the car up and take stock (and cry!).
After just over 30 mins I headed out for the next run.
Fourth run 11.97 @ 116.17 60ft 1.93
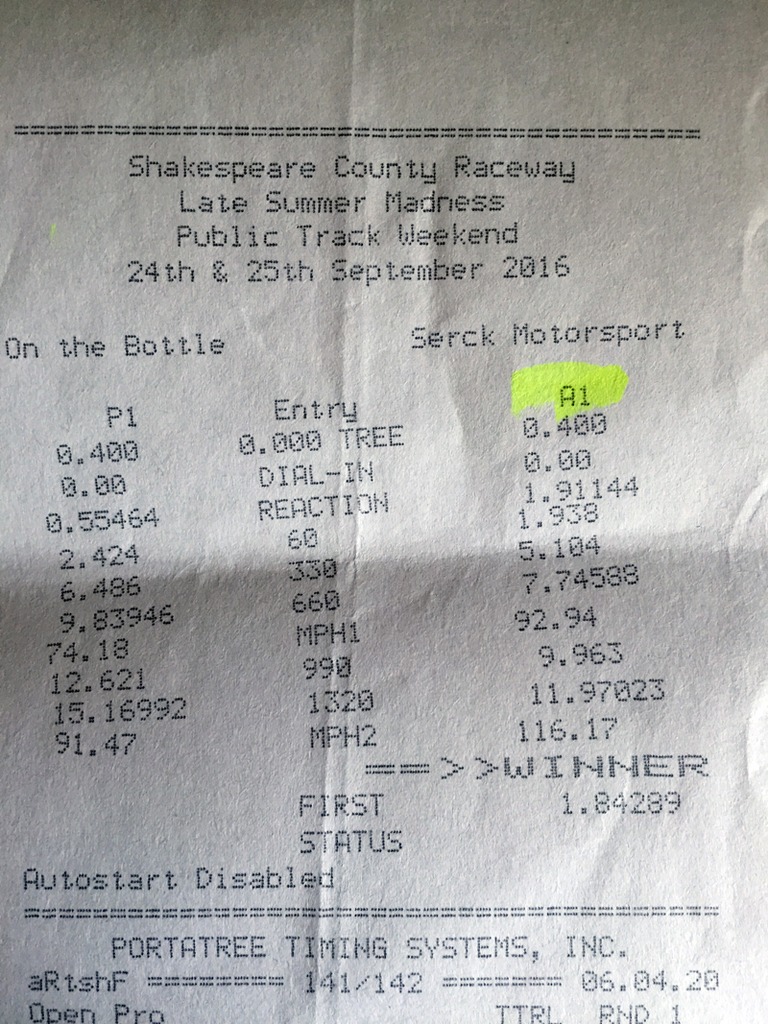
The track had been running for just over an hour by now and it�s amazing how quickly a track can evolve as more cars run, increasing track temp and rubber laid down to increase overall grip.
OK, the ET and 60ft were still crap but look how the terminals have picked up. The car felt much better after launching then the previous runs. The strip on the whole was starting to feel quicker and the car was more stable after launching�. That increase in terminals backs that up.
If the car was now achieving that ET with that 60ft and terminal speed, things were looking a lot more positive now. I�ve just got to try and get a better launch in.
Something I noticed was that the inlet temps were very high after each run, so I decided to take the approach of letting the car cool between each run for at least 20mins. In my opinion this isn�t the best thing, as you tend to lose heat from your tyres (grip) and from your downpipe and turbo exhaust housing. It�s really good to ensure your exhaust housing and downpipe are red hot to ensure gas speed (power output) is optimum. Fine line here though as you don�t want heat soak.
I can�t wait to get this intercooler swapped out!
Fifth run 11.87 @ 116.03 60ft 1.87
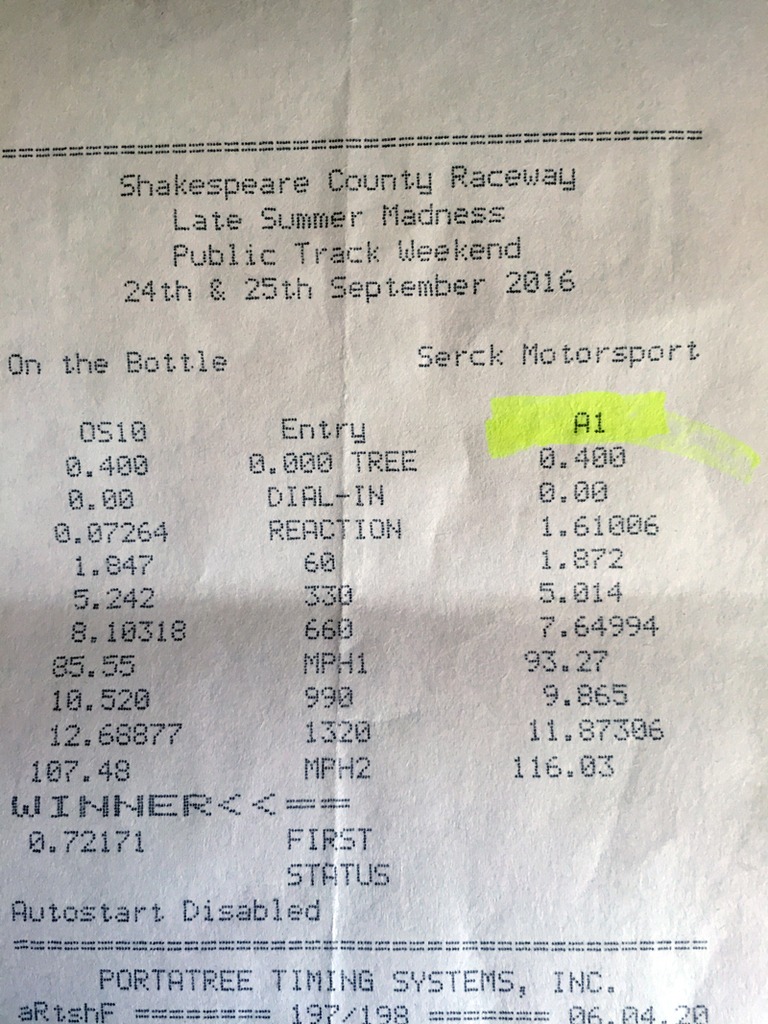
We�re in the 11.8�s!!!! Still maintaining terminals but still struggling off the line.
At this stage I also took another 2psi out of the fronts. We�re now down to 30psi at the fronts, whilst the rears are still stock pressures.
Sixth run 11.80 @ 116.10 60ft 1.80
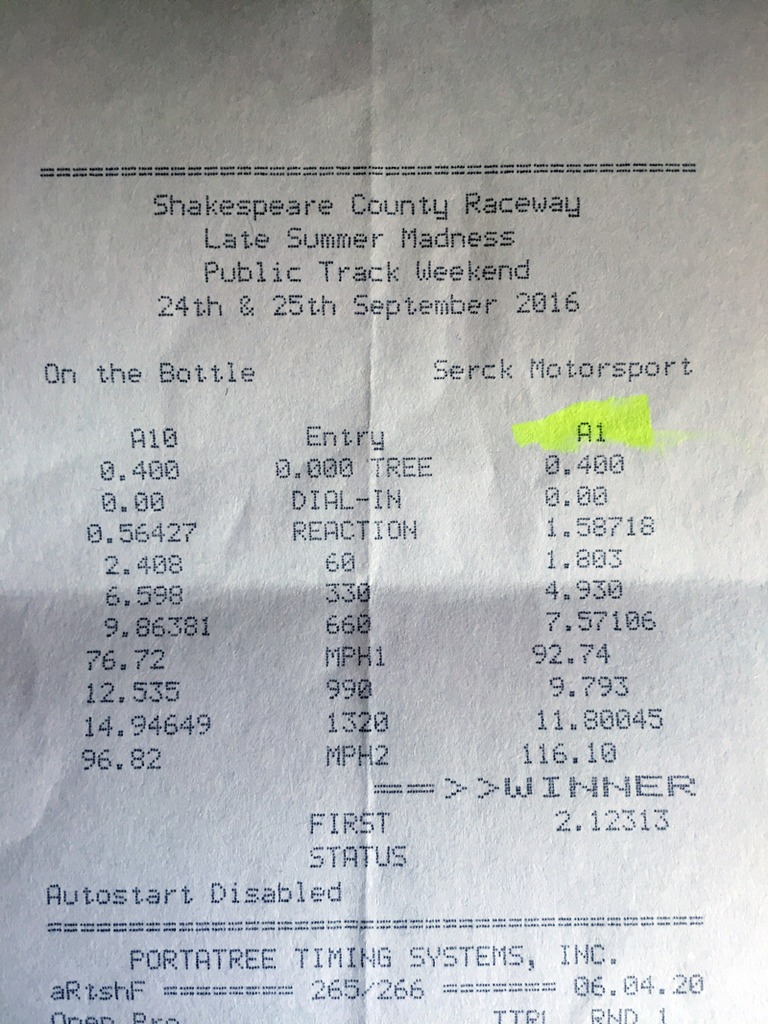
Boom!! 11.80 dead!!
To be precise it was 11.80045. That�s 4/10,000ths of a second away from an 11.7!!! That is crazily close.
Much better 60ft this time, but I know there is more left in the car on launching. The rest of the run felt proper solid.
It�s worth pointing out that even with this time the fronts are still spinning up on launch and the front is axle tramping. It�s mental!
I got greedy here and did a back to back run straight after.
Seventh run 11.86 @ 115.36 60ft 1.78
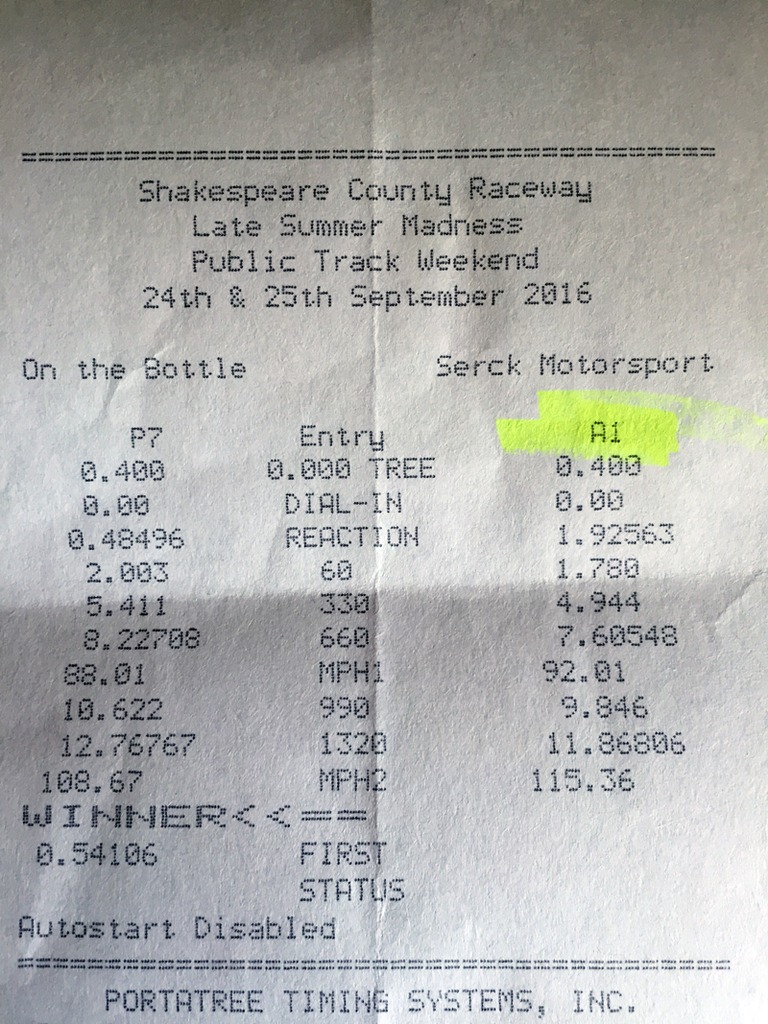
Triple *****!!!!
I finally bust into the 1.7�s 60ft, but got a worse ET and trap speed. That�s exactly what happens when you get heat soak - you lose power!!!! Surely had that launch been without heat soak, I think I�d be staring at an 11.7x timing slip now! Damn�� but as I like to say, it does it when it does it.
Time for a rest (for the car and me!) looking to running again after lunch.
Eighth run 12.05 @ 115.30 60ft 1.95
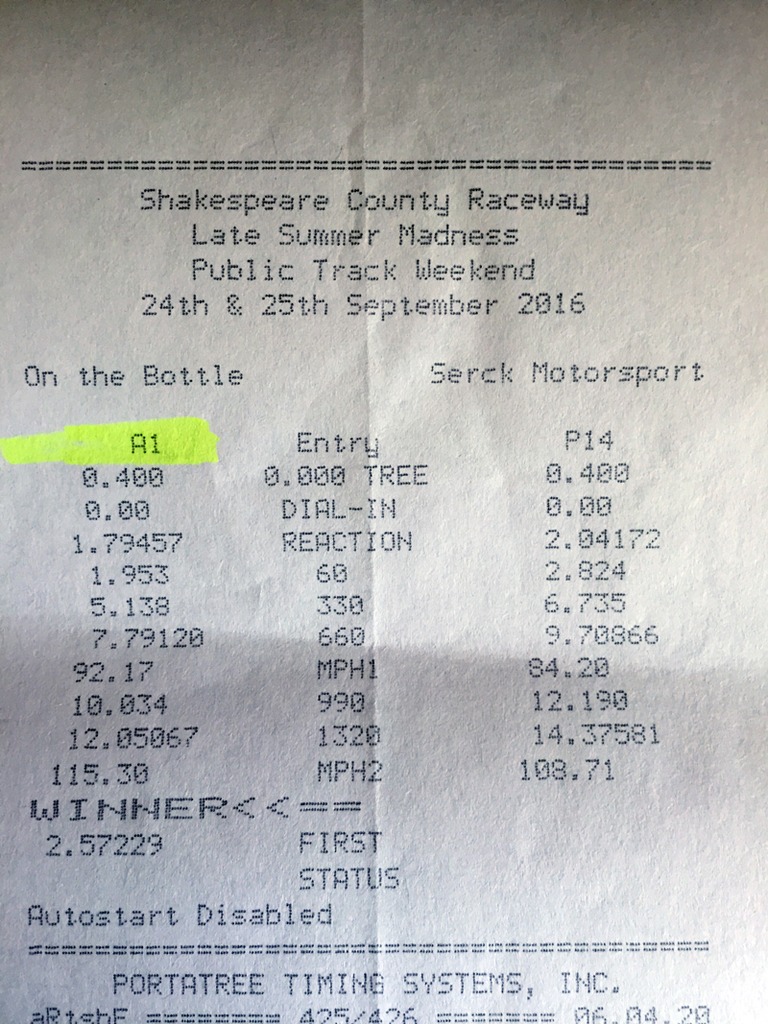
This run was some 1.5hrs since the last run, and look at how quickly the track can change again!
These were the worst grip levels I had experienced all day up the strip. I�m not over exaggerating here, but the tyres were squealing all the way through 1st, 2nd and 3rd. That�s crazy.
Look at that 60ft! Ha
Ninth run 12.03 @ 115.28 60ft 1.91
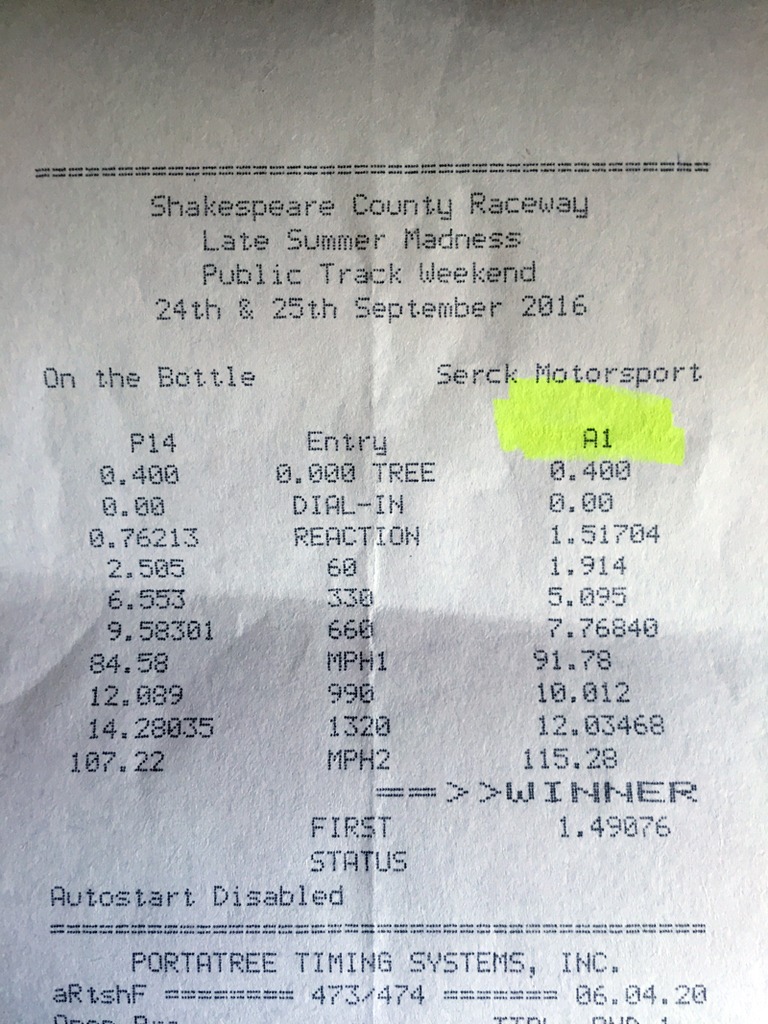
The track had clearly taken a turn for the worse during the afternoon.
That�s it�. I�m done for today!
Positives
It�s amazing how better track conditions can change the times. OK it�s not when you think about it, but there has been a marked improvement seen even at the same level of tune. A point probably worth underlining here, this car has not seen any further changes since the last runs at Santa Pod. It�s in the same state of tune.
To put down an 11.80s quarter is brilliant. Based on what I know this is the quickest official drag strip time for a Stage 1 RS3 on stock tyres, full fat weight and pump fuel in the UK. Also I managed to do 3 x 11.8x passes on the same day.
Based on the testing done today I�m as confident as I can be that the car, even at this level of tune, has an 11.7x drag strip pass in it.
The other element I�m really happy with is the trap speeds. Hitting 116+ at the quarter, especially with 10psi taken out of the front tyres, is impressive. It backs up the BHP claims from my dyno plots in my opinion.
The torque increases seen on my dyno plot (+100ftlb over the stock run on my car) is real in my opinion, which is why the stock launch control strategy is causing me ultimate grip issues on launch. Too much sauce on launch.
Let�s see where we are now versus the stock drag runs I did:
Stock
12.34 @ 111.25mph; 60ft in 1.83s; 330ft in 5.13; ⅛ in 7.92 @ 88.75
Stage 1
11.80 @ 116.10mph; 60ft in 1.80s; 330ft in 4.93; ⅛ in 7.57 @ 92.74
Negatives
It�s easy to get side tracked by focussing on these performance times, but this car is for the road and that is what�s most important to me. I don�t launch the car on the road, I drive it through the gears. The drag figures do not highlight how quick and driveable this car is on the road.
Grip is ultimately my current enemy on the strip at the moment. There are a number of options I will investigate, focussed on what changes can be made to the launch strategy (reducing boost).
I could also look at increasing mechanical grip�.. Fitting different tyres and/or the wider 255�s on the front. To be honest I would rather not put 255�s on the front.
One thing I will look at is geometry. Stock factory geometry is normally quite loose, so I�ll get the car on the alignment rig and tighten that up if needed.
The last but probably the easiest, is to start running the car at Santa Pods Peak Performance days. This is when they heavily prep the track, and continue to keep that up through the day. This ensures the strip is at it�s most grippiest. The downside is that these days are �60, as opposed to the normal �25. But since this doesn�t mean I need to change anything else, and it�s only affecting the drag strip outcome (potentially), it does kind of make sense to at least try this route.
I�m not going to bother messing around with anything for the next few weeks, it�s Stage 2 testing after all during early October.
VBOX Data
I can�t stress this enough�. These are figures from the drag strip run, not for road runs.
As per the drag times, the other areas of acceleration also saw a marked improvement from the Santa Pod runs. Better track conditions / grip is good thing!
These are taken from the quickest quarter run logs:
0-60mph in 3.40s
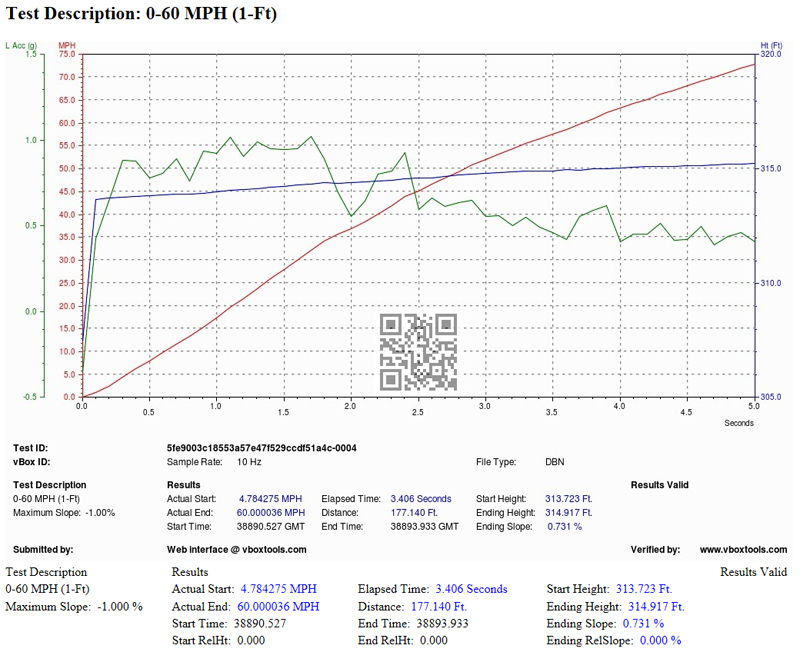
60-100mph in 5.08s
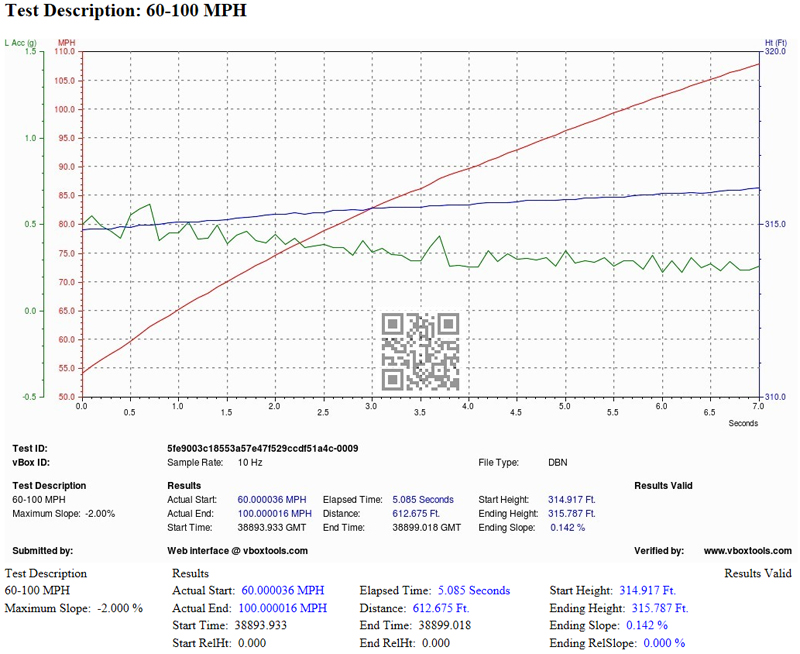
0-100mph in 8.49s
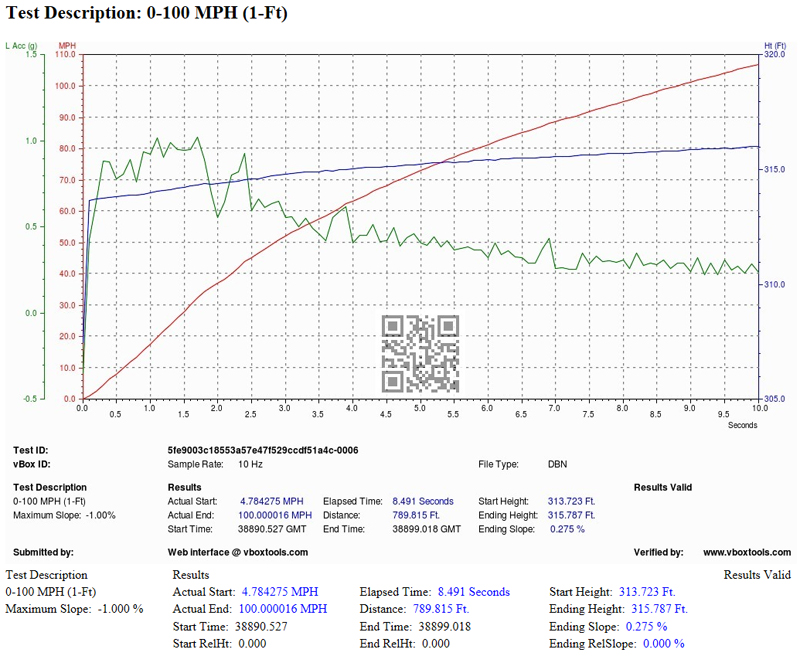
Looking back at what was achieved at Santa Pod, these figures have been improved upon as follows:
0-60 0.1s quicker
60-100 0.23s quicker
0-100 0 0.32s quicker
Personally, I would expect the measures / results to be even quicker on the public highway.
The data logged via VBOX is very informative, way beyond just giving performance figures. One thing you can look at is the amount of g�s the car is pulling, which can allude to drop off�s in power / traction.
I�m noticing that the 1st to 2nd gear change is quite harsh and the box appears to stutter when doing a fully loaded launch run. Together with the wheelspin and axle tramping I get, this can be seen on the g�s plotted.
Let�s look at the VBOX quarter mile log associated to the quickest drag run achieved:
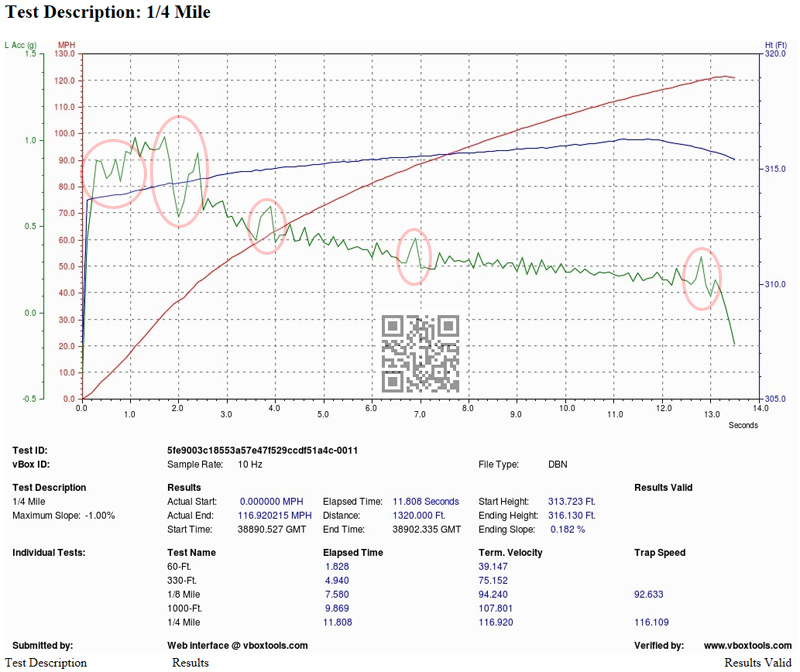
I�ve highlighted five areas from left to right on the g plot.
The 1st from the left is showing lack of traction initially, which will be a combination of wheelspin and the front axle tramping. It doesn�t gain full traction until around 16mph.
The 2nd from the left is showing the fairly substantial 1st to 2nd gearbox shift stutter. I�ve seen this on stock car logs, but I think this is being amplified by the Stage 1 remap.
A DSG remap may help certainly for the 2nd issue.
Whilst not affecting the run in reality the 3rd, 4th and 5th areas have been highlighted as these show the 2nd to 3rd, 3rd to 4th and finally 4th to 5th gear changes.
25 September 2016, 02:28 PM
#18

Thats inpressive times there shaun.
Considering the costs involved with cars like these and the a45s etc that would worry alot more expensive machinery with figures like that
Considering the costs involved with cars like these and the a45s etc that would worry alot more expensive machinery with figures like that

 16 October 2016, 11:18 AM
#21
Scooby Regular
Thread Starter
Engine Stage 2 Development
Put simply this is going to be about testing an upgraded intercooler and also a map adjustment to suit.
Upgraded Intercooler
Whilst I didn�t labour this point as part of the Stage 1 write up, it was apparent that increasing charge temps on the dyno were a bit of an issue.
On the stock map the intercooler was �ok� but once we pushed the boost levels up, charge temps were increasing. This was even more evident when back to back runs were completed, which when you�re mapping can be fairly unavoidable.
A dyno cell is a very harsh environment�. Even the ones that have very good airflow. Whilst I�m adamant that you�ll see better airflow on the road, the results measured on a dyno are fairly indicative as to what happens to charge temps on repeated road pulls, or even single pulls when ambient temps are high. This issue is further amplified when you start to increase power.
Whilst there are a number of intercoolers available for the RS3 8V I decided to plumb for the one from Forge. Most of us know of Forge and their products always appear to get decent reviews and their prices are reasonable in my opinion.
To better gauge before and after results directly without any changes to the setup, it was decided to remove the front bumper and replace as much as possible (in readiness for the Forge intercooler), but whilst still retaining the stock cooler. Then run on the dyno and swap out the intercooler in situ and run again.
First off the bumper was removed to show the stock intercooler setup:
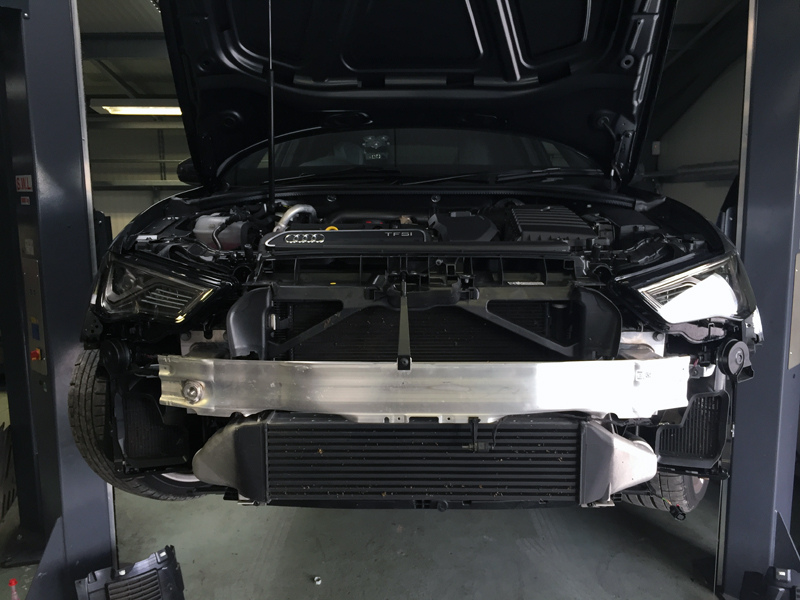
The large alloy frame above the stock intercooler is the standard crash bar. The stock intercooler is below and to the left and right of this are the oil, and I�m pretty sure a transmission cooler. Plenty of coolers on these cars!
Next up was to remove the OEM crash bar and replace it with the new revised Forge version. For clarity this is actually an OEM crash bar that�s been modified. Modified? Well it needs to be to enable the larger Forge intercooler to be fitted. You�ll see this further on.
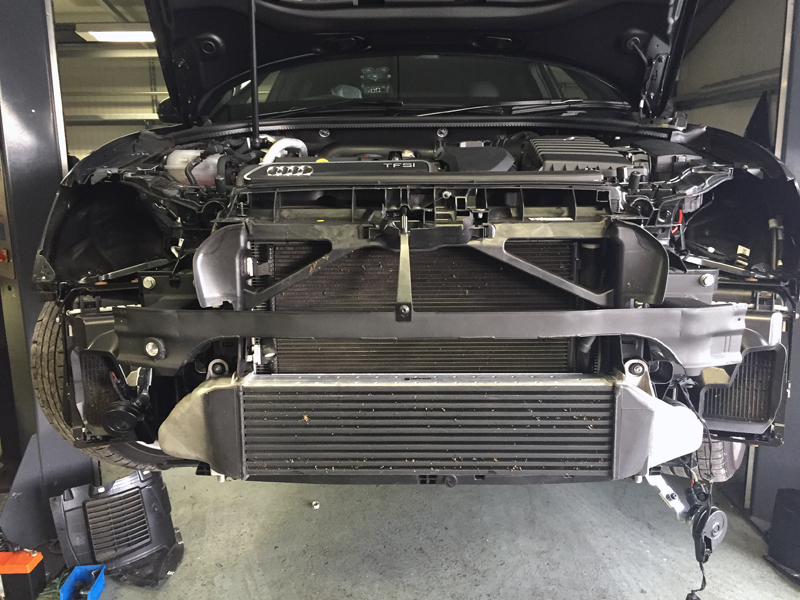
The space between the stock intercooler and the new crash bar gives you an immediate indication how much taller the new Forge intercooler will be.
Some other intercoolers available are getting on for double height. Whether or not this actually makes any discernible difference to cooling ability I don�t know. Personally I think it�s predominantly about the quality of the core (which you can�t see). Surface size isn�t everything in my opinion.
At the end of the day manufacturers quote all kinds of figures about dimensions, airflow, pressure drop. All I want to know is �Does this intercooler work better and how much better?�.
So with the stock intercooler in place the car was strapped down on the dyno for some stock intercooler baseline runs:
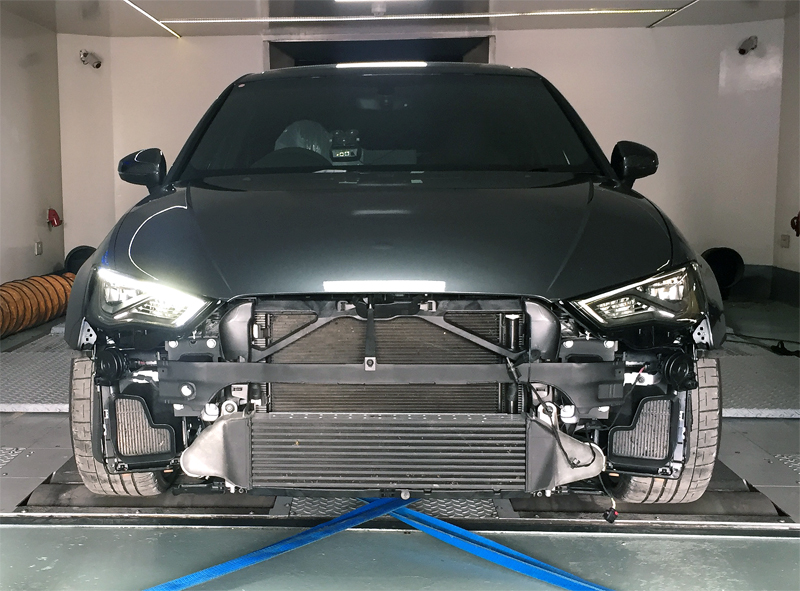
Once these were completed we fitted the new Forge unit:
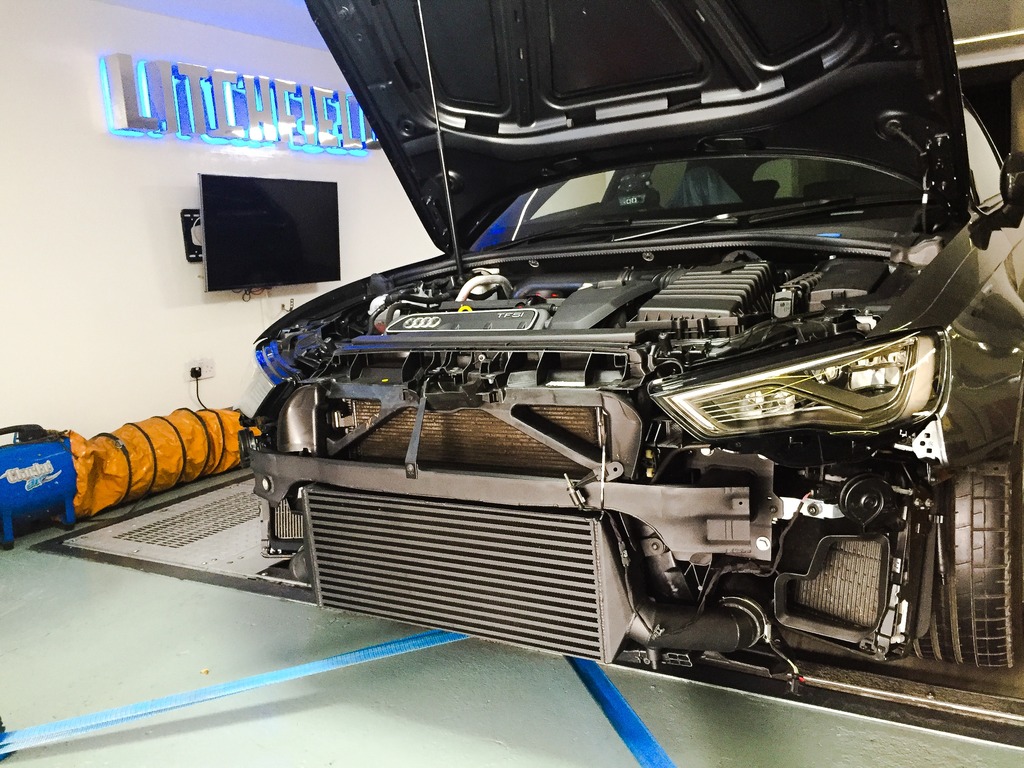
You can see how it nicely fills that void, up against the modified crash bar. Looks great as well all in black.
The new Forge intercooler is bigger than the stock item and here is a further image to show this in comparison:
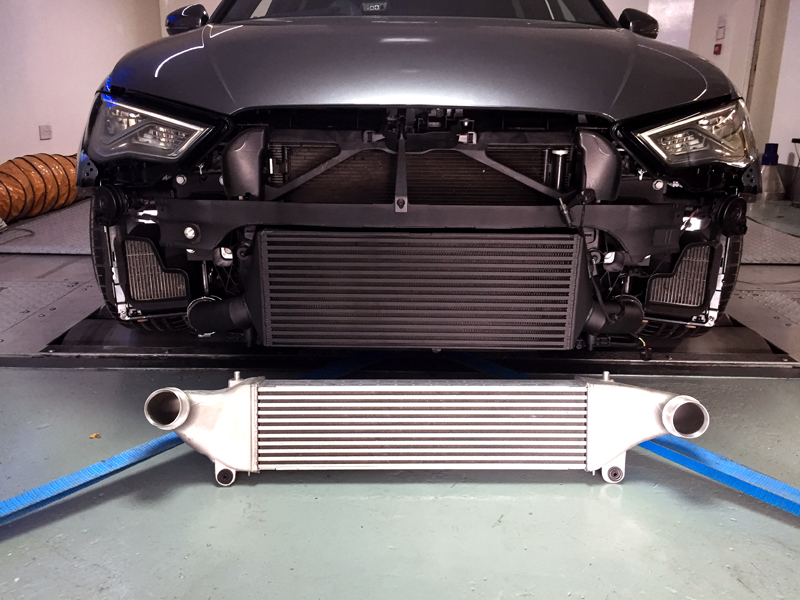
Car was then run on the dyno again�..
So let�s look at the differences in charge temps between stock and the Forge intercooler.
Stock Intercooler
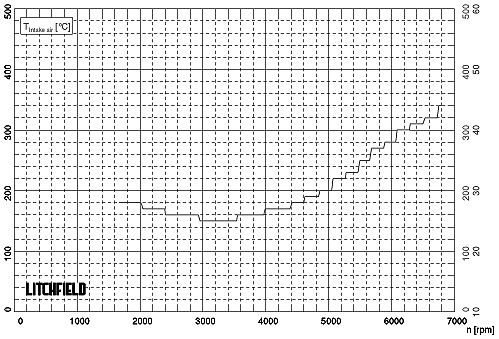
Run Number: 1st cool run (i.e. no significant heat soak - the best it can be I suspect for the ambients once the engine was up to temp)
Ambient Temp: 16.8degs
Charge Temp at Start of Run: 28degs
Charge Temp at End of Run: 44degs
Forge Intercooler
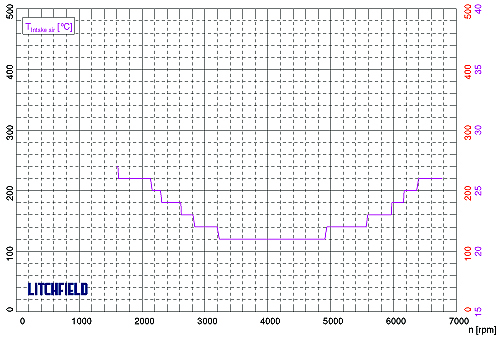
Run Number: 3rd back to back run on the Forge unit
Ambient Temp: 17.5degs
Charge Temp at Start of Run: 27degs
Charge Temp at End of Run: 26degs
Pictures (with a few important stats) can speak a thousands words!
The Forge intercooler is so much more efficient over and above the stock item. Not only does it sustain the drop through 3-5k rpm, but it also maintains much lower temps at the top end of the run by a tangible amount (18degs lower). Couple this with the fact that the above Forge charge temp plot was taken from the THIRD back to back run, and the Stock charge temp plot was the first run on the stock cooler, it really does provide context to how much better the Forge item is.
If you look at the data further you can see that whilst the Forge drops the charge temp through the mid range, this was only 3.5degs over ambient! That�s bloody good by anyones standards.
It would appear that this Forge intercooler works well. Very well.
Power Increases?
Sorry to disappoint�.. There were none (both runs compared above achieved 430bhp). Being honest I wasn�t expecting any increases just by putting the new intercooler on.
In my opinion unless your OEM cooler is so inefficient, just putting a new intercooler on won�t magically make more power over and above what you had before �just because�. What it will do is ensure that what you should have, you have more chance of maintaining on repeated high load runs (on a dyno, but more importantly on the road) and / or due to increasing outside ambient temps. It can also give you ability to run more boost / ignition, where otherwise you may have been limited due to high charge temps.
You may see �instant� increases in power if the dyno you have used does not have really good airflow in my opinion, or you have an amount of heatsoak (which is what the Forge tests on their website allude to). A dyno is a harsh environment and I do feel at times this harsh environment (with inadequate cooling / airflow) can show some increases with a new cooler as being smoke and mirrors, without any other changes being made. Sure, I have known other types of cars to benefit instantly from a change in cooler, but that has been due to how severely ineffective the stock item was.
A more efficient intercooler will enable you to maintain power for longer, but you can�t just take your previous power figure and just assume you can add power on to that just because of an upgraded intercooler.
Make no mistake this new Forge intercooler is much more efficient over and above the stock intercooler��. By a country mile.
Fitment
Every other intercooler upgrade I�ve had done you�ve had to cut this, shave that and alter this.
Thankfully the Forge unit is straightforward to fit with no cutting and shutting.
It was definitely straightforward for me because I stood there and watched someone else do it, but I suspect you get what I mean.
One of the things that needs to be done is all of the plastic and cowling / foam needs to be removed from the back of the front bumper. There are full instructions to tell you how, and this either pulls off and or unscrews. Easy!
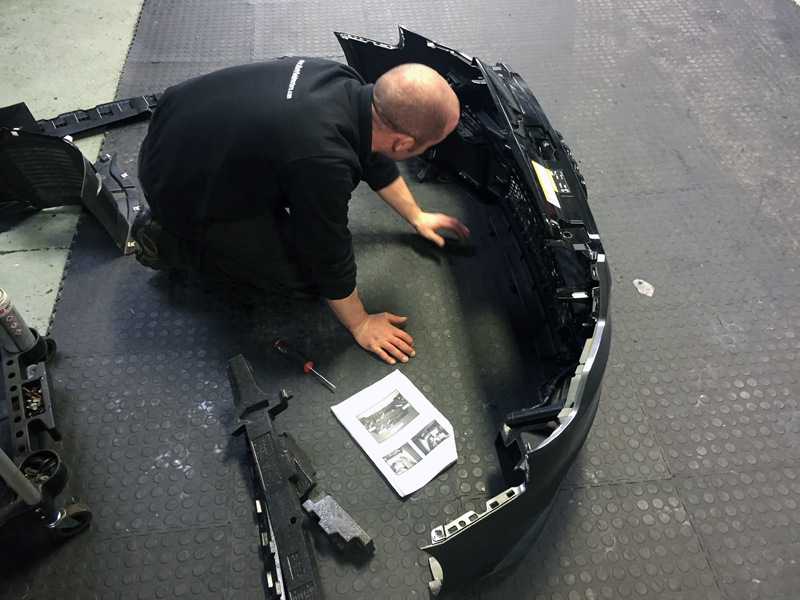
The only consideration is the number plate��
Whilst it�s not a major deal, if you wish to retain the OEM plate surround then that will have to be fixed to the grill from the rear of the grill by other means. Or you just fix the plate directly to the grill, but then you�ll have to screw it in rather than stick it.
One other option is to do this��.
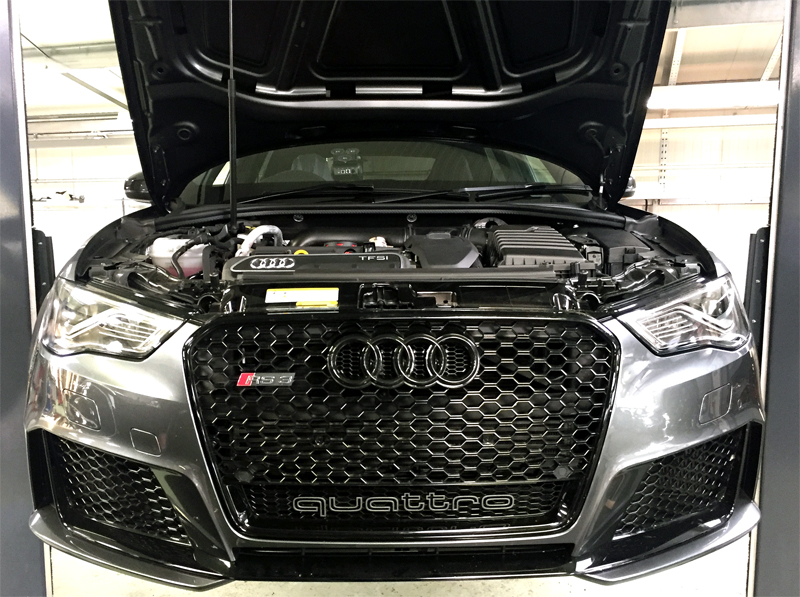
I think this looks so aggressive�.. I stuck with this option.
Something else fitted was a set of lower boost silicon hoses from Forge. I have the upper hose set as well, but this will be fitted at a later date.
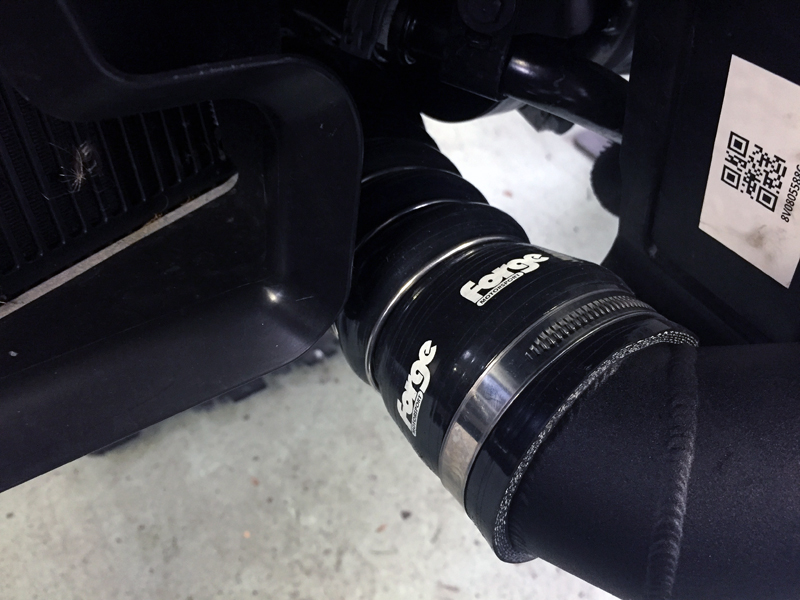
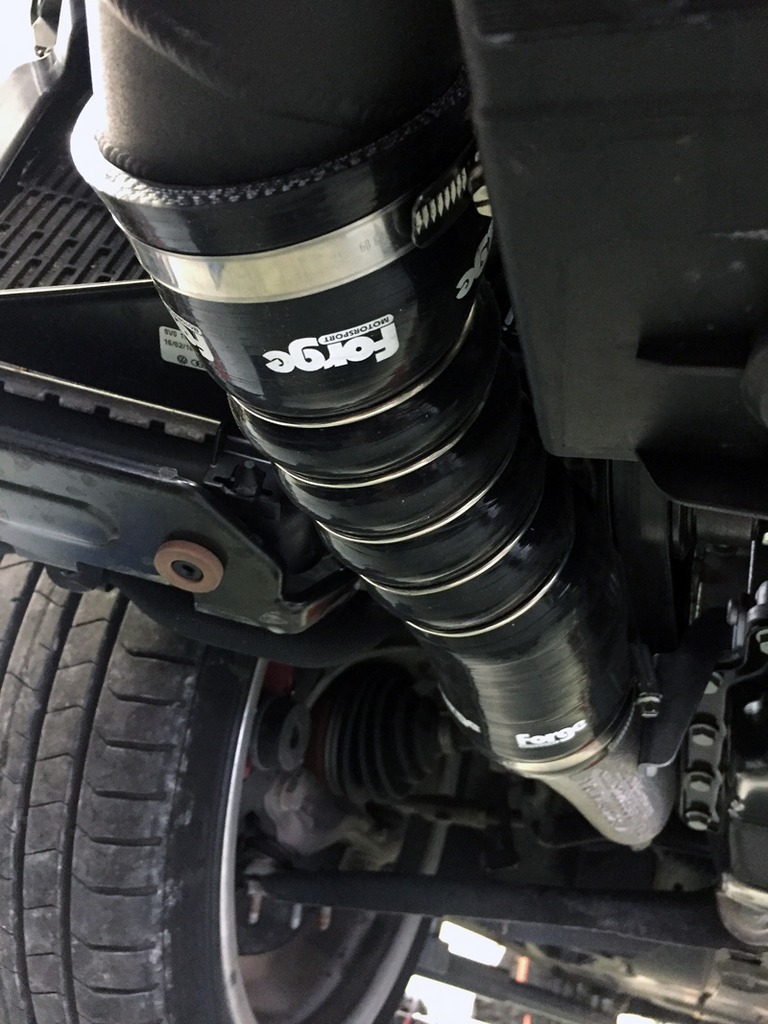
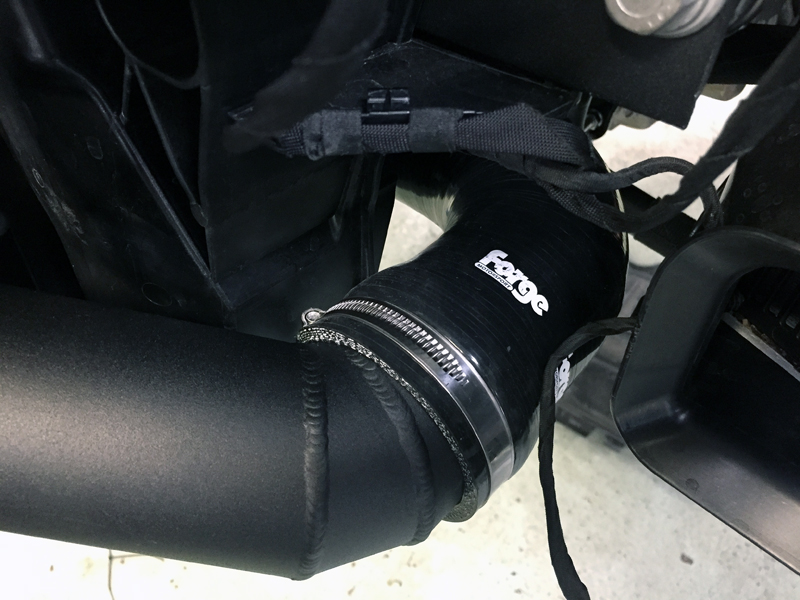
Revised ECU Remap
This was one other area (apart from helping to sustain any power achieved) I was hoping that the new intercooler would pay dividends�..
One of the key elements that we couldn�t increase any more at Stage 1 was ignition (without the ECU retarding). Whether or not this was in part down to charge temps, we�d soon find out.
Litchfields wanted to try quite a few different things with this remap, so it was decided to leave the car with them.
This is where they ended up:
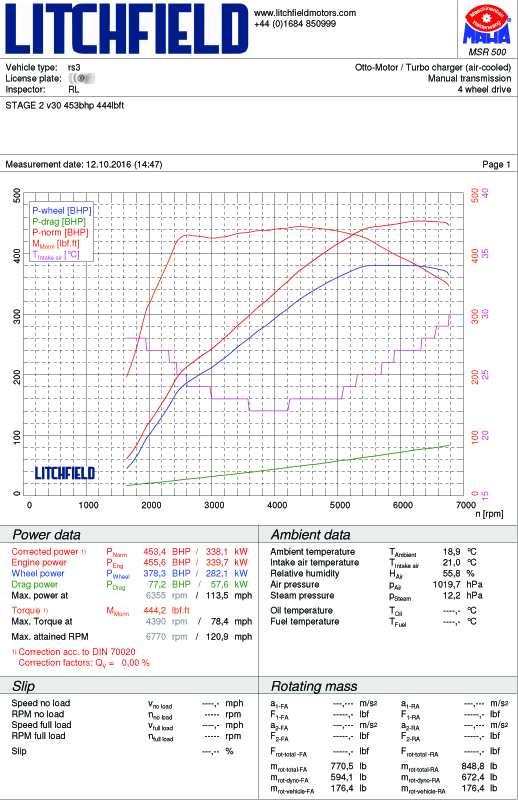
Summary of Spec
MY16 RS3
Litchfield Stage 2 ECU calibration
Forge Intercooler
Miltek Secondary Decat Pipes
Fuel - VPower Nitro (99 oct)
Stage 2 TEST 1 figure achieved was 453.4bhp & 444.2lbft @ flywheel
Comparing this against Stage 1 TEST 3 figure we saw the following:
+19.8 bhp + 6.9lbft (peak) over Stage 1 TEST 3
+4.5% bhp +1.5% lbft (peak) over Stage 1 TEST 3
Overall Stage 2 TEST 1 comparison against stock
+65.4 bhp +94.2 lbft (peak)
+16.8% bhp +26.9% lbft (peak)
Stage 2 TEST 1 - Comments
It should never be about the peak figures, but it�s always nice to increase the top end again by around +20bhp!
The car actually made 457bhp on a few runs, but consistently made 453bhp. Just thought I�d mention that for bragging rights! lol
Whilst the peak boost levels were only adjusted slightly (running 1.5bar flat through the mid-range, tailing off to around 1.2bar at peak power), the results attained were very positive with work put into the ignition map and overall boost control benefiting from the new Forge intercooler now in place.
Iain (Litchfield) did say to me that he was very impressed with how the intercooler worked on the dyno. This car had a lot of runs�. Many of which were back to back, yet the intercooler provided stability to charge temps not seen before. You can see on the above run even at this level after a number of back to back runs, the charge temps are well in check. As a comparison during Stage 1 after 3-4 back to back runs the charge temps were over 60degs (virtually the same ambient temps as during Stage 2 as well!). That�s how well this Forge cooler is working.
One other key element that has now been delivered under Stage 2 is how much quicker the torque builds and lasts compared to Stage 1.
We�ll have to have a look at an overlay for that to become clearer:
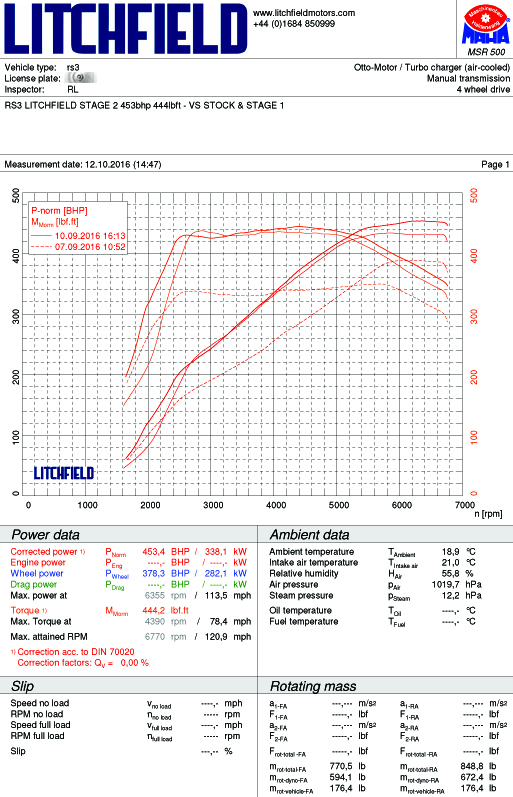
Whilst this graph is quite �busy� it shows Stage 2 vs Stage 1 vs Stock, if you look at the lowdown torque you�ll see that this is much better with Stage 2. Stage 2 gains around 200rpm earlier torque and around 200rpm extension to torque from over 5k. This ultimately makes the torque curve wider.
Lowdown you�re talking +40lbft between 1600 - 2500rpm.
Clearly there are BHP increases between Stage 1 & 2, but this is predominantly from 4k+, with the more significant gains from 5k+.
Because boost hasn�t really been increased through the mid-range, peak torque hasn�t really altered much from Stage 1, but it was felt that 1.5bar was ample through the mid range and the engine was happy with this.
As the torque is ramping up much quicker now early on, it�s quite difficult to control boost as it hits initial peak boost. That is why you see a very slight dip in the initial part of the torque curve, as this is to prevent any overboost. With a bit more time this could be further ironed out, but it�s a minor point in reality. I�m being overly ****.
Overall the curves are very smooth.
Just as a giggle I decided to overlay the dyno plot from my Litchfield Stage 2 A45 vs where the RS3 is currently:
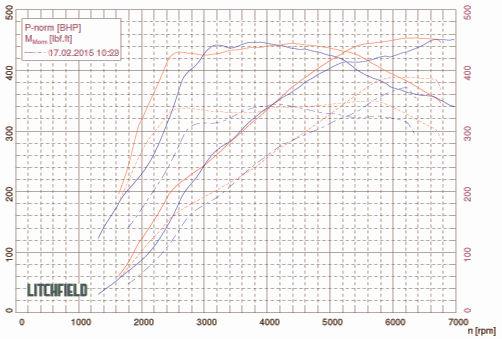
The blue lines are the A45. The red lines are the RS3.
This is a good example of peak figures not telling the whole story, as between the two cars the peak figures are nigh on identical�.. But see how much better the RS3 power/torque is. So much smoother curves and like +100lbft of torque more lowdown. That�s pretty immense and my A45 wasn�t a slow car!
Stage 2 TEST 1 - Road
The car feels better now at the top end as it certainly pulls harder, more than the dyno figure differences appear to suggest in my opinion.
The torque comes in hard and fast down low�. It feels quite brutal. I never felt I was lacking for torque lowdown with Stage 1, but this just feels like it�s turned it up to No.11 now in comparison.
Regardless of these changes the car is smooth, responsive and very driveable�.. Feels really nice on the road.
Whilst the Forge intercooler has helped increase power safely I also suspect that the added benefit of better managing charge temps on the road is also having an impact to how the car feels. Every time you floor it, it feels ballistic�.... On each repeated full load run.
For me that�s Stage 2 done and dusted.
I intend to get back down the quarter mile again this coming weekend, to see if Stage 2 improves my times. My concern more than ever now is launch grip. We�ll see how that goes.
I�m not assuming I will better my last time�.. The dragstrip is never that straight forward. It will be interesting and fun to try though!
In principle the context of Stage 3 has been agreed. If it pans out as expected, this will be exciting using a different approach to the tried and tested.
Stage 3 will begin during November all being well�. So expect more news on this very soon!
Put simply this is going to be about testing an upgraded intercooler and also a map adjustment to suit.
Upgraded Intercooler
Whilst I didn�t labour this point as part of the Stage 1 write up, it was apparent that increasing charge temps on the dyno were a bit of an issue.
On the stock map the intercooler was �ok� but once we pushed the boost levels up, charge temps were increasing. This was even more evident when back to back runs were completed, which when you�re mapping can be fairly unavoidable.
A dyno cell is a very harsh environment�. Even the ones that have very good airflow. Whilst I�m adamant that you�ll see better airflow on the road, the results measured on a dyno are fairly indicative as to what happens to charge temps on repeated road pulls, or even single pulls when ambient temps are high. This issue is further amplified when you start to increase power.
Whilst there are a number of intercoolers available for the RS3 8V I decided to plumb for the one from Forge. Most of us know of Forge and their products always appear to get decent reviews and their prices are reasonable in my opinion.
To better gauge before and after results directly without any changes to the setup, it was decided to remove the front bumper and replace as much as possible (in readiness for the Forge intercooler), but whilst still retaining the stock cooler. Then run on the dyno and swap out the intercooler in situ and run again.
First off the bumper was removed to show the stock intercooler setup:
The large alloy frame above the stock intercooler is the standard crash bar. The stock intercooler is below and to the left and right of this are the oil, and I�m pretty sure a transmission cooler. Plenty of coolers on these cars!
Next up was to remove the OEM crash bar and replace it with the new revised Forge version. For clarity this is actually an OEM crash bar that�s been modified. Modified? Well it needs to be to enable the larger Forge intercooler to be fitted. You�ll see this further on.
The space between the stock intercooler and the new crash bar gives you an immediate indication how much taller the new Forge intercooler will be.
Some other intercoolers available are getting on for double height. Whether or not this actually makes any discernible difference to cooling ability I don�t know. Personally I think it�s predominantly about the quality of the core (which you can�t see). Surface size isn�t everything in my opinion.
At the end of the day manufacturers quote all kinds of figures about dimensions, airflow, pressure drop. All I want to know is �Does this intercooler work better and how much better?�.
So with the stock intercooler in place the car was strapped down on the dyno for some stock intercooler baseline runs:
Once these were completed we fitted the new Forge unit:
You can see how it nicely fills that void, up against the modified crash bar. Looks great as well all in black.
The new Forge intercooler is bigger than the stock item and here is a further image to show this in comparison:
Car was then run on the dyno again�..
So let�s look at the differences in charge temps between stock and the Forge intercooler.
Stock Intercooler
Run Number: 1st cool run (i.e. no significant heat soak - the best it can be I suspect for the ambients once the engine was up to temp)
Ambient Temp: 16.8degs
Charge Temp at Start of Run: 28degs
Charge Temp at End of Run: 44degs
Forge Intercooler
Run Number: 3rd back to back run on the Forge unit
Ambient Temp: 17.5degs
Charge Temp at Start of Run: 27degs
Charge Temp at End of Run: 26degs
Pictures (with a few important stats) can speak a thousands words!
The Forge intercooler is so much more efficient over and above the stock item. Not only does it sustain the drop through 3-5k rpm, but it also maintains much lower temps at the top end of the run by a tangible amount (18degs lower). Couple this with the fact that the above Forge charge temp plot was taken from the THIRD back to back run, and the Stock charge temp plot was the first run on the stock cooler, it really does provide context to how much better the Forge item is.
If you look at the data further you can see that whilst the Forge drops the charge temp through the mid range, this was only 3.5degs over ambient! That�s bloody good by anyones standards.
It would appear that this Forge intercooler works well. Very well.
Power Increases?
Sorry to disappoint�.. There were none (both runs compared above achieved 430bhp). Being honest I wasn�t expecting any increases just by putting the new intercooler on.
In my opinion unless your OEM cooler is so inefficient, just putting a new intercooler on won�t magically make more power over and above what you had before �just because�. What it will do is ensure that what you should have, you have more chance of maintaining on repeated high load runs (on a dyno, but more importantly on the road) and / or due to increasing outside ambient temps. It can also give you ability to run more boost / ignition, where otherwise you may have been limited due to high charge temps.
You may see �instant� increases in power if the dyno you have used does not have really good airflow in my opinion, or you have an amount of heatsoak (which is what the Forge tests on their website allude to). A dyno is a harsh environment and I do feel at times this harsh environment (with inadequate cooling / airflow) can show some increases with a new cooler as being smoke and mirrors, without any other changes being made. Sure, I have known other types of cars to benefit instantly from a change in cooler, but that has been due to how severely ineffective the stock item was.
A more efficient intercooler will enable you to maintain power for longer, but you can�t just take your previous power figure and just assume you can add power on to that just because of an upgraded intercooler.
Make no mistake this new Forge intercooler is much more efficient over and above the stock intercooler��. By a country mile.
Fitment
Every other intercooler upgrade I�ve had done you�ve had to cut this, shave that and alter this.
Thankfully the Forge unit is straightforward to fit with no cutting and shutting.
It was definitely straightforward for me because I stood there and watched someone else do it, but I suspect you get what I mean.
One of the things that needs to be done is all of the plastic and cowling / foam needs to be removed from the back of the front bumper. There are full instructions to tell you how, and this either pulls off and or unscrews. Easy!
The only consideration is the number plate��
Whilst it�s not a major deal, if you wish to retain the OEM plate surround then that will have to be fixed to the grill from the rear of the grill by other means. Or you just fix the plate directly to the grill, but then you�ll have to screw it in rather than stick it.
One other option is to do this��.
I think this looks so aggressive�.. I stuck with this option.
Something else fitted was a set of lower boost silicon hoses from Forge. I have the upper hose set as well, but this will be fitted at a later date.
Revised ECU Remap
This was one other area (apart from helping to sustain any power achieved) I was hoping that the new intercooler would pay dividends�..
One of the key elements that we couldn�t increase any more at Stage 1 was ignition (without the ECU retarding). Whether or not this was in part down to charge temps, we�d soon find out.
Litchfields wanted to try quite a few different things with this remap, so it was decided to leave the car with them.
This is where they ended up:
Summary of Spec
MY16 RS3
Litchfield Stage 2 ECU calibration
Forge Intercooler
Miltek Secondary Decat Pipes
Fuel - VPower Nitro (99 oct)
Stage 2 TEST 1 figure achieved was 453.4bhp & 444.2lbft @ flywheel
Comparing this against Stage 1 TEST 3 figure we saw the following:
+19.8 bhp + 6.9lbft (peak) over Stage 1 TEST 3
+4.5% bhp +1.5% lbft (peak) over Stage 1 TEST 3
Overall Stage 2 TEST 1 comparison against stock
+65.4 bhp +94.2 lbft (peak)
+16.8% bhp +26.9% lbft (peak)
Stage 2 TEST 1 - Comments
It should never be about the peak figures, but it�s always nice to increase the top end again by around +20bhp!
The car actually made 457bhp on a few runs, but consistently made 453bhp. Just thought I�d mention that for bragging rights! lol
Whilst the peak boost levels were only adjusted slightly (running 1.5bar flat through the mid-range, tailing off to around 1.2bar at peak power), the results attained were very positive with work put into the ignition map and overall boost control benefiting from the new Forge intercooler now in place.
Iain (Litchfield) did say to me that he was very impressed with how the intercooler worked on the dyno. This car had a lot of runs�. Many of which were back to back, yet the intercooler provided stability to charge temps not seen before. You can see on the above run even at this level after a number of back to back runs, the charge temps are well in check. As a comparison during Stage 1 after 3-4 back to back runs the charge temps were over 60degs (virtually the same ambient temps as during Stage 2 as well!). That�s how well this Forge cooler is working.
One other key element that has now been delivered under Stage 2 is how much quicker the torque builds and lasts compared to Stage 1.
We�ll have to have a look at an overlay for that to become clearer:
Whilst this graph is quite �busy� it shows Stage 2 vs Stage 1 vs Stock, if you look at the lowdown torque you�ll see that this is much better with Stage 2. Stage 2 gains around 200rpm earlier torque and around 200rpm extension to torque from over 5k. This ultimately makes the torque curve wider.
Lowdown you�re talking +40lbft between 1600 - 2500rpm.
Clearly there are BHP increases between Stage 1 & 2, but this is predominantly from 4k+, with the more significant gains from 5k+.
Because boost hasn�t really been increased through the mid-range, peak torque hasn�t really altered much from Stage 1, but it was felt that 1.5bar was ample through the mid range and the engine was happy with this.
As the torque is ramping up much quicker now early on, it�s quite difficult to control boost as it hits initial peak boost. That is why you see a very slight dip in the initial part of the torque curve, as this is to prevent any overboost. With a bit more time this could be further ironed out, but it�s a minor point in reality. I�m being overly ****.
Overall the curves are very smooth.
Just as a giggle I decided to overlay the dyno plot from my Litchfield Stage 2 A45 vs where the RS3 is currently:
The blue lines are the A45. The red lines are the RS3.
This is a good example of peak figures not telling the whole story, as between the two cars the peak figures are nigh on identical�.. But see how much better the RS3 power/torque is. So much smoother curves and like +100lbft of torque more lowdown. That�s pretty immense and my A45 wasn�t a slow car!
Stage 2 TEST 1 - Road
The car feels better now at the top end as it certainly pulls harder, more than the dyno figure differences appear to suggest in my opinion.
The torque comes in hard and fast down low�. It feels quite brutal. I never felt I was lacking for torque lowdown with Stage 1, but this just feels like it�s turned it up to No.11 now in comparison.
Regardless of these changes the car is smooth, responsive and very driveable�.. Feels really nice on the road.
Whilst the Forge intercooler has helped increase power safely I also suspect that the added benefit of better managing charge temps on the road is also having an impact to how the car feels. Every time you floor it, it feels ballistic�.... On each repeated full load run.
For me that�s Stage 2 done and dusted.
I intend to get back down the quarter mile again this coming weekend, to see if Stage 2 improves my times. My concern more than ever now is launch grip. We�ll see how that goes.
I�m not assuming I will better my last time�.. The dragstrip is never that straight forward. It will be interesting and fun to try though!
In principle the context of Stage 3 has been agreed. If it pans out as expected, this will be exciting using a different approach to the tried and tested.
Stage 3 will begin during November all being well�. So expect more news on this very soon!
19 October 2016, 10:20 AM
#22
Scooby Regular
Shaun, did you not measure the difference in charge temps with the bumper fitted?
Your pictorial would suggest that the temps were measured without the bumper in place?
The original intercooler is going to see significantly different airflow with ducted and sealed airflow compared to running open fronted without where air can pass around rather than through the core.
As such its not a tryuly valid comparison of charge temps before and after the change of intercooler.
Last edited by Devildog; 19 October 2016 at 10:22 AM.
19 October 2016, 08:23 PM
#23
Scooby Regular
Thread Starter
All tests were done with the bumper removed.
The fan unit is ducted to the FMIC area in any case, so I can't see there being a significant difference in flow, bumper on or off. Difference maybe, but you'd have to convince me it would be significant.
I would suggest there is a more significant difference between a dyno and the road, in respects to airflow. Especially when you're hitting 120mph on the dyno.
This was the easiest way to do back to back tests.
20 October 2016, 07:49 PM
#25
Great thread this Love the tuning potential of the RS3, I had a quick browse on a RS3 forum the other night(cant remember the name of it, but your project thread was on there Shaun),
Anyway I was impressed with some of the other project threads on there of the older RS3, There was one thread I was reading with a guy who had a stroker kit and bigger turbo fitted and pushing 650-700bhp!!
Love the tuning potential of the RS3, I had a quick browse on a RS3 forum the other night(cant remember the name of it, but your project thread was on there Shaun), Anyway I was impressed with some of the other project threads on there of the older RS3, There was one thread I was reading with a guy who had a stroker kit and bigger turbo fitted and pushing 650-700bhp!!
20 October 2016, 09:38 PM
#26
Scooby Regular
Thread Starter
There are ones that are pushing 1000bhp. 
Plenty of options..... just depends how far you want to go mate.
I'll stop at Stage 3 I think. Well.......
Plenty of options..... just depends how far you want to go mate.
I'll stop at Stage 3 I think. Well.......
 22 October 2016, 05:23 PM
#28

Shauns threads always detailed and full of data analyses.
How you finding the German brands Shaun are you not tempted to come back to the Subaru fold?
How you finding the German brands Shaun are you not tempted to come back to the Subaru fold?
Last edited by juggers; 22 October 2016 at 08:37 PM.
22 October 2016, 08:09 PM
#30
I have to admit you are mental on how much you want to mod cars, I would hate to think what yo have spent? Just on the last two cars your spending must be quite large and that's only over a small period of time.
Nice car anyway and will be fun to see what you get it to
Nice car anyway and will be fun to see what you get it to

